Donor Journey Mapping for Nonprofits: From First Contact to Long-Term Support

Content authorArtem LozinskyPublished onReading time13 min read
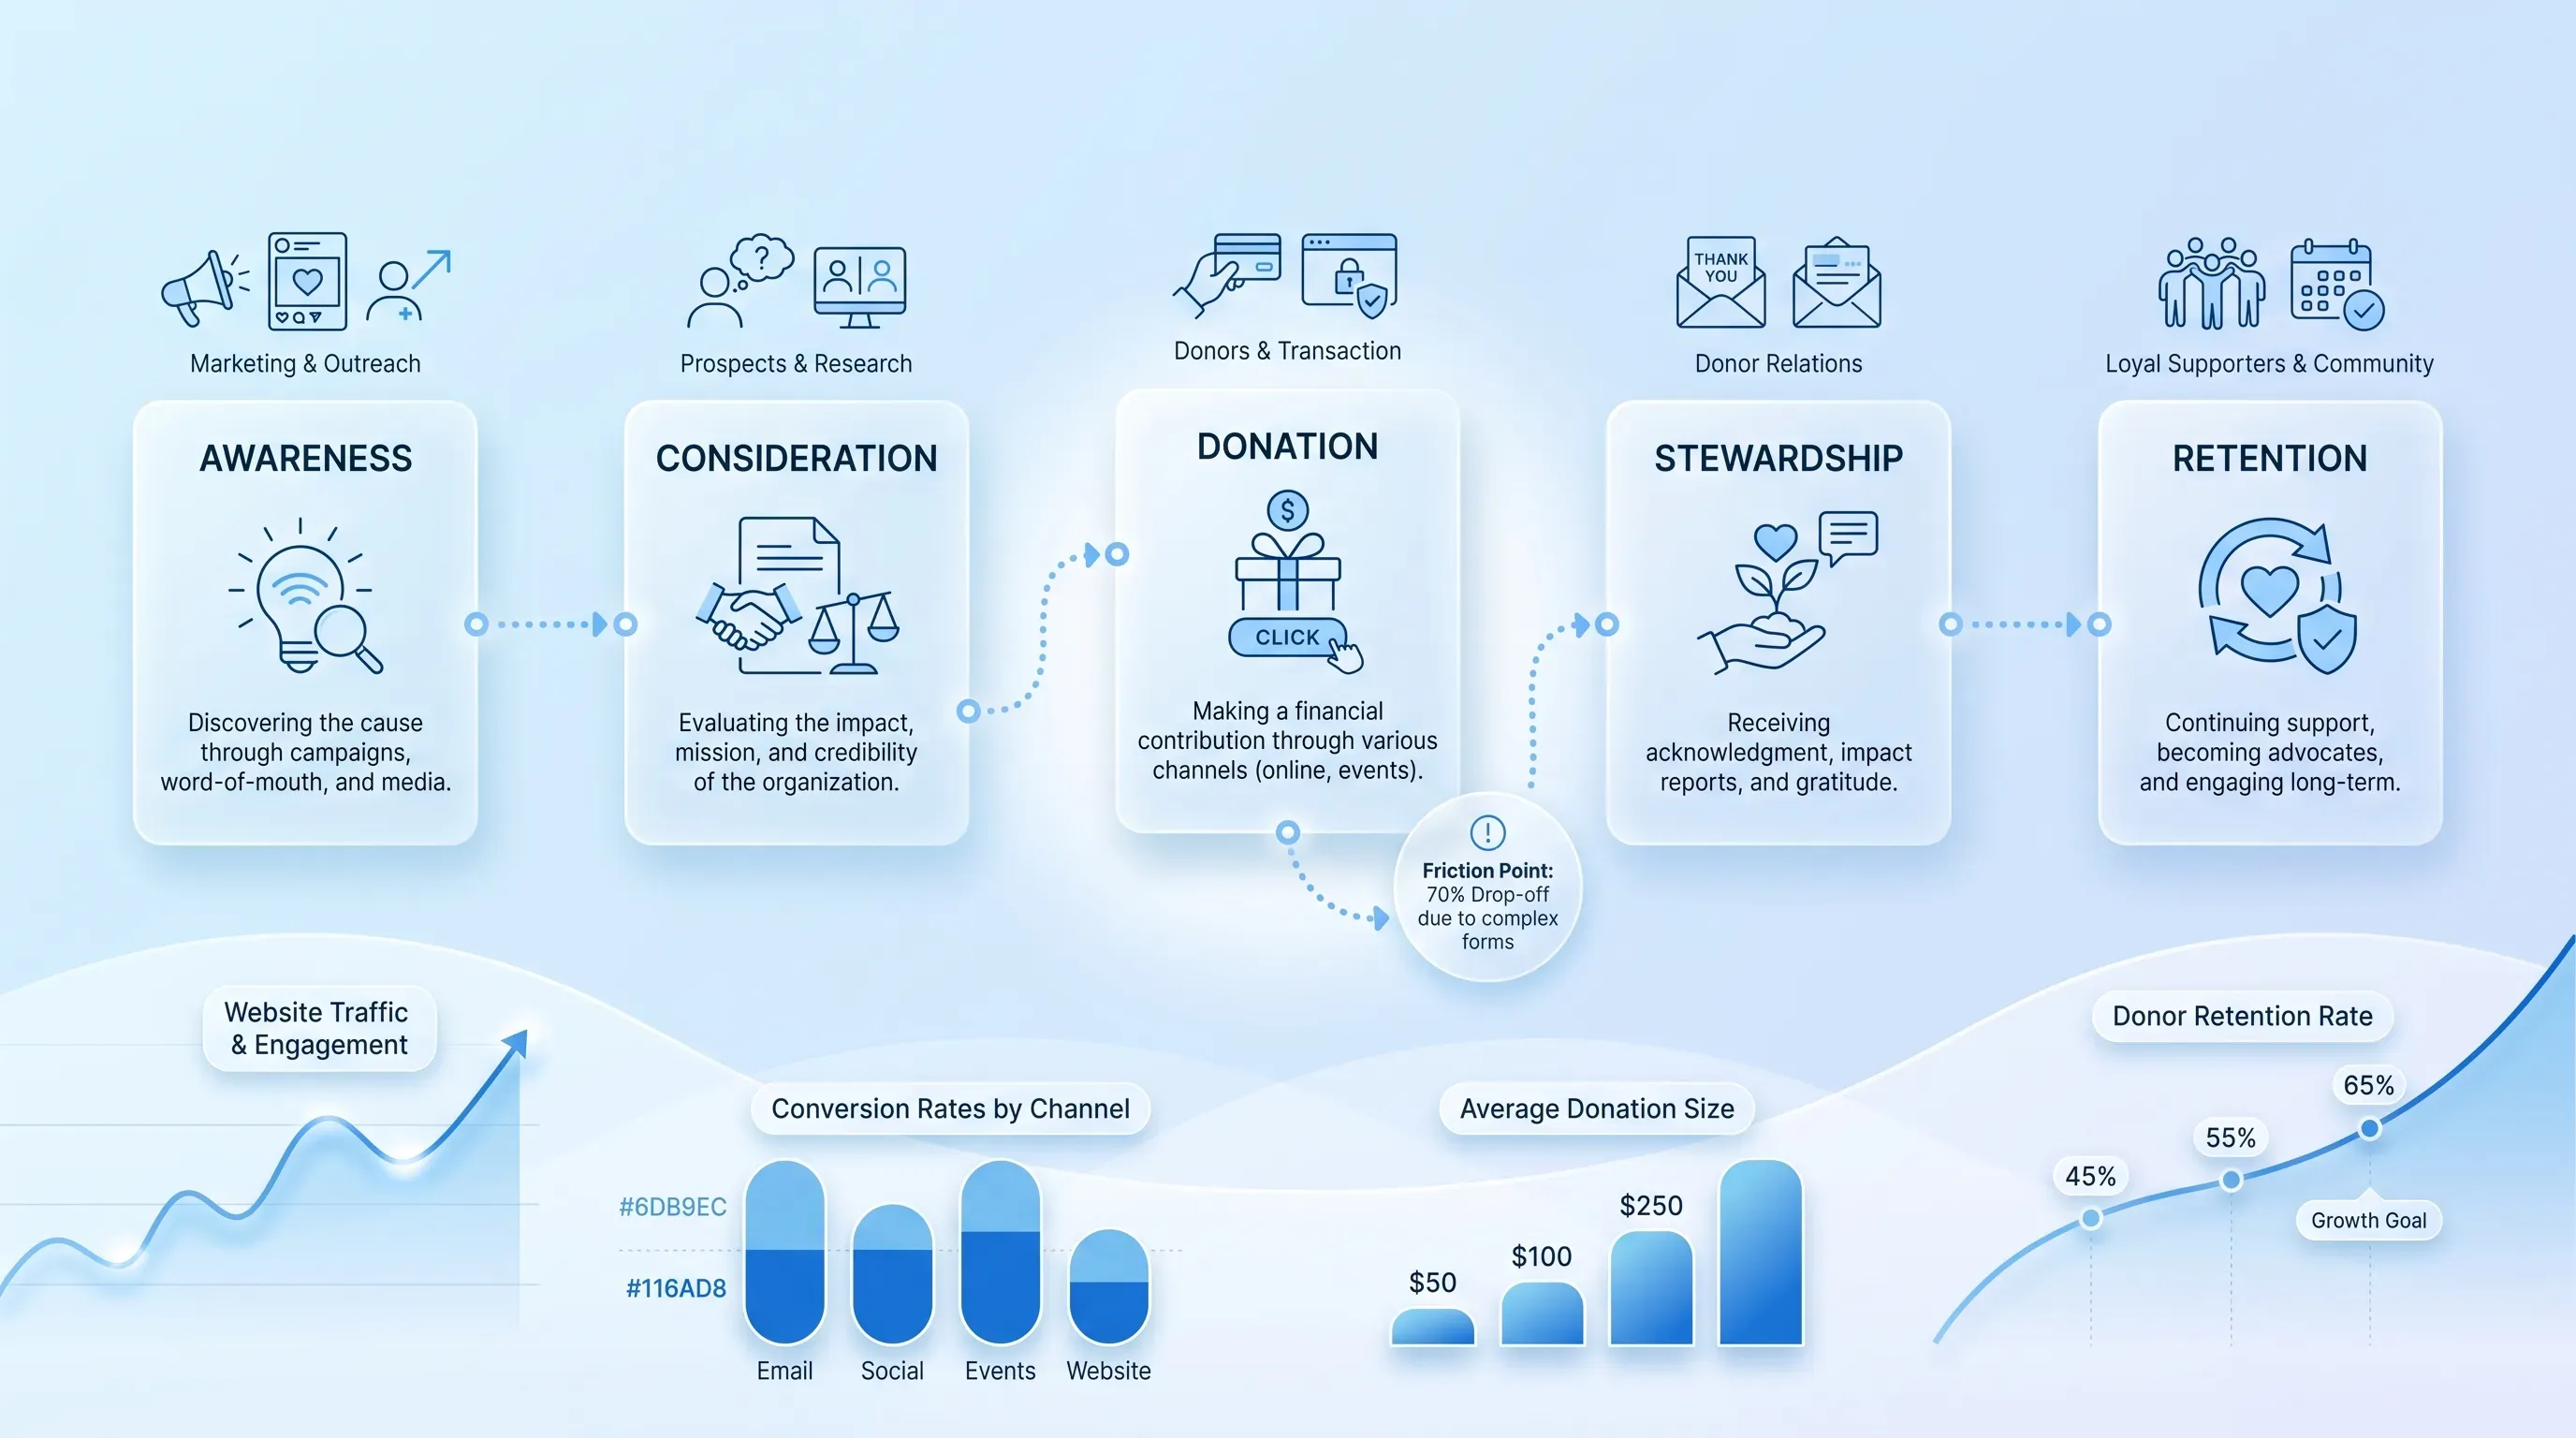
Infographic illustrating the nonprofit donor journey with rounded cards for each stage, set against a light blue to white gradient background.

This article gives you a practical framework for donor journey mapping, from the moment someone discovers your cause through recurring support and advocacy. You will learn how to pick a priority persona and map each stage of the nonprofit donor journey. The finished map then becomes a guide for coordinated fixes across your website and email, with search and campaigns folded into the same effort.

Donor journey mapping basics

Donor journey mapping is a donor-centered view of the whole relationship, from the first moment someone hears about your cause to the point where they give month after month and tell their friends to join in. It starts before the gift and continues long after it. That's the part most nonprofits miss when they picture a funnel that ends the instant money changes hands.

The map is a simple document. It captures a supporter's actions and thoughts at each step. It also records their feelings and names the touchpoint where your organization meets them. When you put those steps side by side, the disconnected pieces of your program start to line up. You see where a question goes unanswered. You see where the emotional tone shifts from curiosity to doubt.

Why does this matter so much right now? Because the sector keeps losing the people it works hardest to win. The overall donor retention rate for 2023 came in at 41.54%, a 2.5% drop from the year before. First gifts are even leakier, with roughly 19 percent of first-time donors giving a second gift. Donor journey mapping shows you where the leaks are before you spend another dollar to fill the bucket.

Set the mapping scope

Don't try to represent every supporter at once. A map that speaks for the grandmother writing a $25 check and the foundation officer reviewing a grant will speak clearly for neither. Pick one meaningful donor persona and one journey. You can expand donor journey mapping later once the method proves itself.

A persona is not a marketing caricature. Build it from evidence you already have. Pull records from your Customer Relationship Management (CRM) system and review the pages people visit before they give. Then read your email engagement numbers. Then talk to actual donors. A handful of short interviews will tell you more about motivation and hesitation than a month of guessing at your desk.

Here is what a working persona needs to capture:

  • The donor's core motivation and the barrier that almost stopped them from giving

  • How they found you and which channels they check

  • Their giving history and communication preferences, drawn from survey answers and campaign results

Then assemble a small working group. You want the person who owns your website or data to join representatives from the fundraising and communications teams. Keep it lean. Before anyone fills in a box, agree on the timeframe you're mapping and define the journey from start to finish, because a three-week campaign journey and a three-year loyalty journey are different animals.

Create the map structure

The donor journey mapping framework itself is a table. Put the journey stages across the top as columns and the planning fields down the side as rows. You can build it in a spreadsheet or on a workshop board with sticky notes. No specialized software is required.

Use a consistent set of rows so every stage gets examined the same way. These are the fields that carry the most weight:

  1. Donor goal at this stage and the key questions on their mind

  2. Emotions they are feeling, along with the channels and touchpoints in play

  3. The action you want them to take next and the friction that blocks it

  4. Content needed to move them forward, the team owner responsible, and the success metric

One rule matters more than the rest. Your first donor experience mapping draft must document the current experience as it exists today. Map the observable experience of someone who lands on your homepage today. When you start from the real experience, every gap you find rests on evidence about the quality of your onboarding.

Map every journey stage

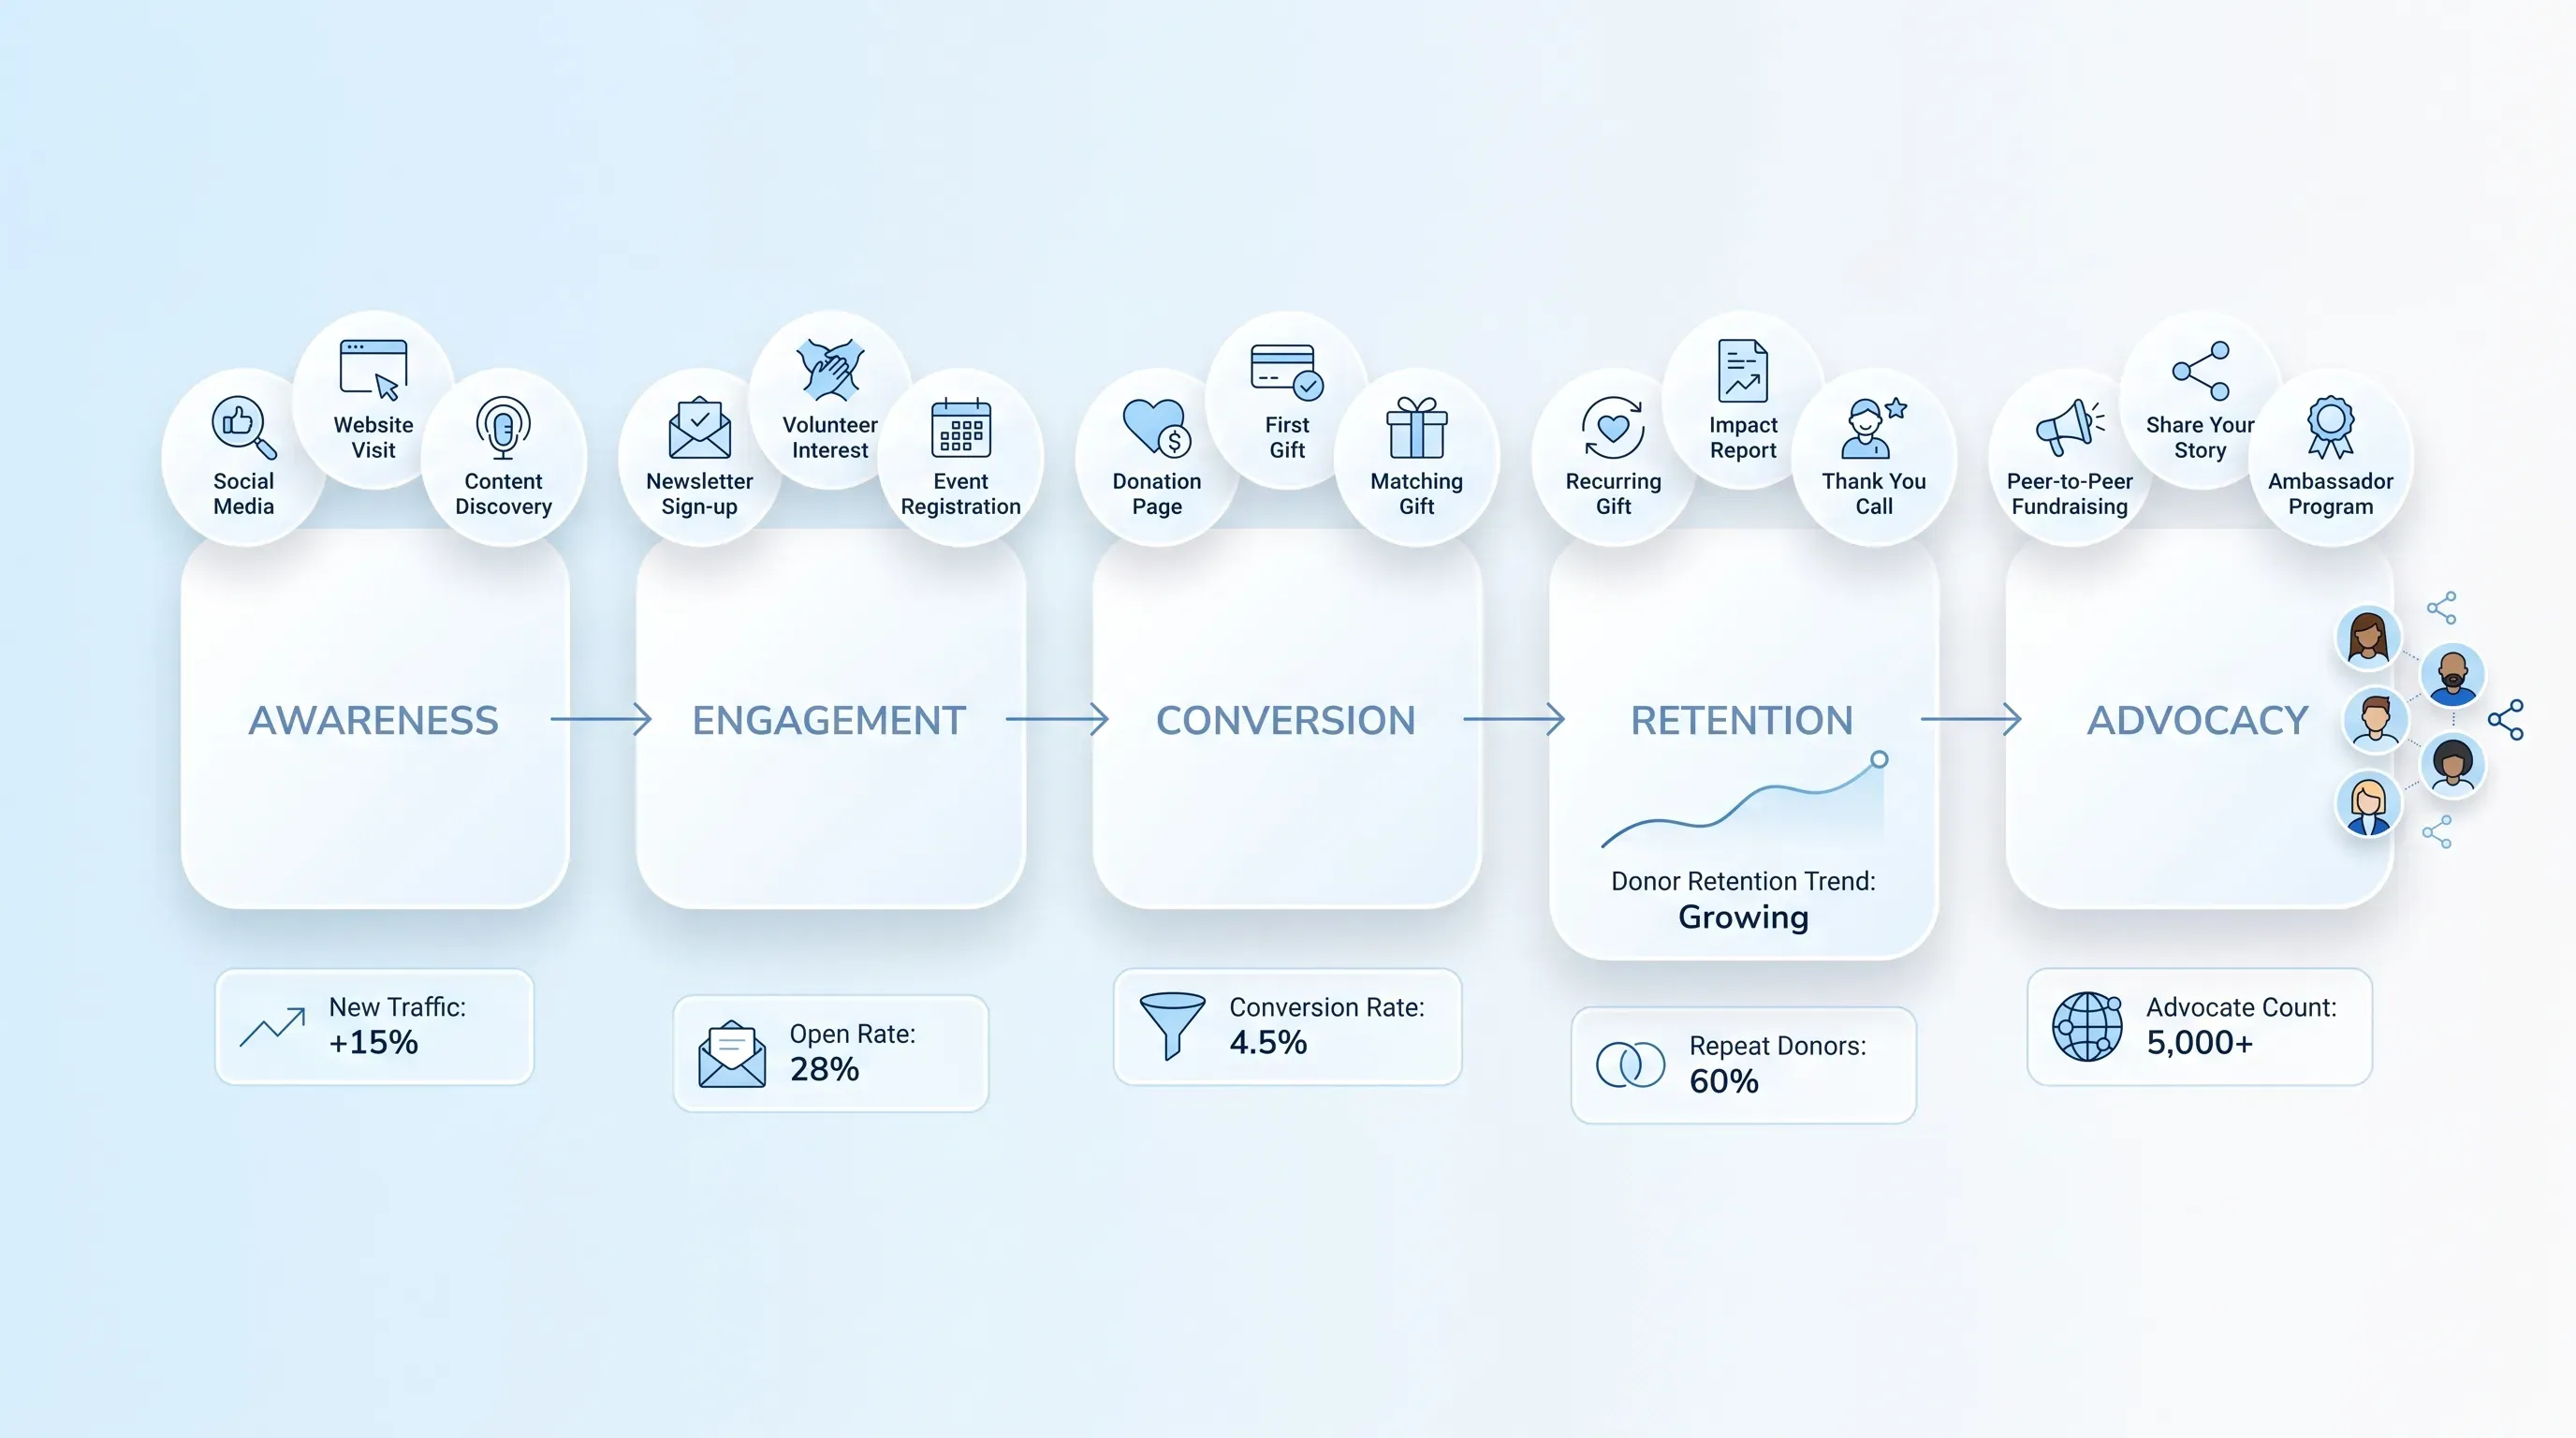
Infographic illustrating the nonprofit donor journey with five translucent cards, icons, and overlapping charts on a soft blue gradient background.

Walk the full path in four stage groups so you can complete the donor journey mapping process in order. For each group, pin down the donor's likely mindset and your organization's job at that moment. Then identify the common touchpoints and helpful content. Finish with the signal that shows the person is ready to move forward.

A nonprofit donor journey doesn't run in a straight line. People pause for months or move back and forth between email and your website. Some go quiet before they return during a campaign. Build in those pauses and re-engagement routes instead of pretending everyone marches from awareness to advocacy without stopping.

Need help with your AI visibility?

Book a free consultation with our experts we'll help you determine exactly which services your organization needs.

Start the nonprofit donor journey

The first group covers awareness and research. Someone has just discovered your cause and is deciding whether your organization is relevant and worth their attention. Their mindset is curious but cautious. They don't know you yet, and they're weighing whether you deserve a closer look.

The touchpoints here are wide. Initial touchpoints include search results and social media. Referrals from friends and media coverage also lead people to your homepage, where they explore program pages along with available financial and impact information. Organic search still does heavy lifting at this stage and accounts for 39% of visits to nonprofit websites even as that share slips under pressure from AI-driven discovery.

Map the questions running through their head. What is the problem, and how bad is it? How does this group actually address it? Are they legitimate, and do they get results? Does any of this line up with what I care about? This is a fragile point in the nonprofit donor journey, and people exit fast when the messaging is vague or the proof of impact is buried three clicks deep.

Build trust and conversion

Trust building and the first donation are two connected moments. Someone can trust you and still not give today, so treat the shift from confidence to action as its own step with its own friction.

What moves a hesitant person toward a gift? Impact stories that show a real outcome. Transparent evidence about where money goes. Third-party validation like a Charity Navigator rating. A clear call to action on a campaign page, and a donation form that loads fast and works on a phone. That last point is not optional. Mobile made up 53% of nonprofit website traffic in the 2025 M+R Benchmarks, yet the average donation page still converts only 8% of mobile visitors against 11% on desktop.

The emotion here moves from interest to confidence, or it stalls out on friction. Capture the specific blockers, such as an unclear sense of what the gift will do or a form that asks for too much. Also record unexpected processing fees or limited payment options. A weak confirmation screen can leave the donor wondering whether it worked. Donation forms already carry a 68% abandonment rate, and every extra field on a phone makes it worse. Donor experience mapping at this stage is mostly about removing effort, one field and one fee at a time.

Improve donor experience mapping

The gift went through. Now the clock starts on the most neglected stretch of the whole relationship. Your job in the first days is to confirm the person made a good choice, because their doubt is highest right after they hand over money to a group they barely know.

Use donor experience mapping to define what should happen and how fast. The receipt lands immediately. A prompt, personalized thank-you follows, and it beats a generic auto-reply by a wide margin. Penelope Burk's research found that first-time donors who got a personal thank-you within 48 hours were four times more likely to give again. A short welcome series should follow, with a chance to set communication preferences. An early impact update then shows the gift at work.

Donor experience mapping in this window means resisting the urge to ask for more money right away. Donors have real questions here. How exactly are my funds used? What happens next? Answer those before you make another ask. Watch for warning signs that show the relationship is cooling, such as low email engagement or an unsubscribe. A complete lack of a second interaction sends the same signal. The stakes are plain when you remember that roughly 70% of donors give only once.

Need help with your AI visibility?

Book a free consultation with our experts we'll help you determine exactly which services your organization needs.

Grow support and advocacy

The last group covers the move from a retained donor into a recurring supporter and, eventually, an active advocate. This is where the math turns in your favor. The average recurring donor stays over 8 years and reaches a lifetime value above $7,600, compared with $3,620 for a non-recurring donor who lasts under two years.

What deepens involvement? Demonstrated impact that keeps proving the gift mattered. A relevant upgrade or monthly-giving ask should arrive at a moment of connection. Recognition and community participation can deepen involvement. Shareable stories let a supporter bring others in. Peer-to-peer fundraising belongs here too, and it's a strong acquisition engine, with 80% of first-time donors to an organization giving through a P2P campaign.

One caution belongs in the donor journey mapping process. Advocacy and recurring support follow trust. They are not automatic next steps you can force. Build in respectful off-ramps and preference controls so a donor who wants to give quietly once a year can do exactly that without being pushed toward a monthly commitment they never asked for.

Add a reusable example

Here is a compact donor journey mapping example you can copy into a spreadsheet. The persona is Maria, a first-time small-dollar donor who finds a local after-school program through a search for youth services in her city. After a $30 gift, she becomes a $15-a-month supporter over the following year. Treat every detail below as a placeholder you must replace with your own donor evidence.

  • Awareness: Maria searches "after-school programs [her city]." Her question is whether the group is real and local. She feels hopeful but skeptical. Touchpoint is organic search into a program page. The friction is a thin page with no photos or outcomes. Content needed is a clear program description with local proof. Owner is the web or SEO lead. Metric is qualified organic visits.

  • First gift: Maria reads an impact story and clicks Donate. She wants to know her $30 does something specific. She feels moved but rushed. Touchpoint is the mobile donation form. The friction is eight required fields and no digital wallet. Content needed is a gift-impact line and a one-screen form. Owner is fundraising. Metric is mobile donation-page completion.

  • Onboarding: Maria gets an instant receipt and a personal thank-you email the next morning. She wonders what happens next. She feels reassured. Touchpoint is the welcome email series. The friction is a generic auto-reply with no impact. Content needed is a three-email welcome with a preference-setting link. Owner is communications. Metric is welcome-series open and click rate.

  • Advocacy: Maria has given three times and clicks a monthly-giving link in an update. She wants to know her ongoing support is used well. She feels committed. Touchpoint is a recurring-gift page and a share button. The friction is no easy way to invite friends. Content needed is a shareable story and a simple P2P option. Owner is fundraising and communications together. Metric is recurring-gift conversion and referrals.

The structure is the reusable part. Your own interviews must overwrite Maria's questions and fears. Your CRM data must do the same for her channels.

Connect channels to stages

A finished donor journey mapping framework is only useful if it changes how your channels work together. Each channel has a natural home on the nonprofit donor journey, and problems start when they operate as separate departments sending contradictory messages.

Search Engine Optimization (SEO) supports discovery and research. It answers cause-led queries in a way that matches search intent. Useful educational pages and credible program information then reach someone at the exact moment they're looking. Website user experience (UX) then carries that visitor from learning to giving through intuitive navigation and accessible mobile pages. Visible trust signals support a donation flow with as little friction as you can manage. Given that only 1.6% of website visitors donate, the handoff from content to form is where money is won or lost.

Email owns the relationship after the first gift. It runs the welcome and the stewardship updates. It also handles re-engagement when someone goes quiet before the eventual recurring-giving ask. Fundraising campaigns sit across all of this as coordinated moments inside the wider relationship that reflect what a donor already received. When your teams share messaging and data, a monthly donor stops getting a cold acquisition email addressed to a stranger. That single fix prevents more damage than most new tactics create value.

Measure and improve

Assign a small set of stage-specific metrics so you can tell whether a fix actually worked. More than one or two numbers per stage and your donor journey mapping document turns into a dashboard nobody reads.

  • Discovery: qualified organic visits and engaged visits

  • First gift: donation-page completion and conversion rate

  • Onboarding: welcome-series engagement

  • Stewardship: second-gift rate and overall retention

  • Deeper support and advocacy: recurring-gift conversion, plus referral or peer-to-peer participation

Start by setting a baseline for each metric, because a number means nothing until you know where you began. Segment your results by persona and by acquisition source, since a donor who arrived through a P2P page behaves differently from one who found you through search. Reactivated donors, for instance, retain at 40.4% against 27.9% for brand-new ones, so lumping them together hides what's really happening.

Quantitative data tells you where people drop off. Donor feedback tells you why, and you need both. When you have a list of gaps, rank them by donor impact against implementation effort, then name an owner and a deadline for each change. Review the map after every major campaign, or at minimum once a quarter, so it keeps pace with how your donors actually behave.

Apply the map

Start small. Choose one persona and use real data to map the current journey. Add insights from a few donor conversations, then fix the single highest-impact gap before you expand the exercise. That first win earns you the room to map the next persona.

The point is to make donor journey mapping a shared operating tool that brings your fundraising and communications teams together with the web and program teams. Snoika Foundation helps mission-driven organizations connect donor insight with digital experience to strengthen fundraising execution, which is the exact work donor journey mapping demands. Book a call with our team to review your current journey and decide your next priority.
Need help with your AI visibility?

Book a free consultation with our experts we'll help you determine exactly which services your organization needs.

Plan the first map over one to two weeks, with one defined persona and timeframe. Review existing CRM and website data before donor interviews. Stop when the team identifies one evidence-based friction point, assigns an owner, and selects a measure for the resulting change.

Keep only the personal data required to understand the journey, such as acquisition source, communication preference, and giving history. Remove names, email addresses, and payment details from workshop materials. Limit access to staff with a work-related need, and follow your organization’s privacy policy.

Yes, include offline interactions when they affect a donor’s decision or relationship. Event conversations, direct mail, phone calls, and mailed receipts can shape trust as much as a web page. Record who owns each interaction and how staff will capture feedback or follow-up activity.

Test one change at a time against a clear baseline. For example, compare the completion rate for a shortened donation form with the prior version over the same campaign period. Donor journey mapping works best when the team records the result, keeps effective changes, and revises changes that don’t improve the selected metric.

Snoika Foundation can help a nonprofit review its current digital donor path and identify gaps across search, website content, donation pages, and email. The organization still needs to provide its donor data and staff context, because those records determine the persona, priorities, and measures used in the map.

Book a Demo

Book a time that works best for you