Prioritization Framework: Which Content to Fix First

Content authorArtem LozinskyPublished onReading time11 min read
A modern SaaS dashboard design featuring a blue-focused color palette with clean lines, smooth gradients, and interconnected elements.

This article sets out a scoring method for deciding which webpages to repair or retire when you have hundreds of URLs and a handful of hours each week. It covers evidence gathering and how to check the results in Google Analytics 4.

Start nonprofit content triage

Nonprofit content triage begins with a boundary. Before you score anything, write down the exact set of pages under review and the organisational goals those pages are supposed to serve. Name the audiences too, and the key events already configured in your analytics property, because a key event in Google Analytics 4 is the only reliable proof that a page produced something you care about.

Without that boundary, six hours a week turns into a full site audit that nobody finishes. The Government Digital Service worked through 7,396 content items with the Department for Transport, and that took a dedicated team. You don't have one. So pick 60 to 120 pages and fix the review window at the last 12 months, which lets impact-effort prioritization decide the running order inside that set.

Gather useful evidence

Scoring without evidence produces opinion dressed as a number. Build one spreadsheet, one row per URL, and fill it before anyone argues about priorities. The columns below carry the whole of nonprofit content triage, and they take about two hours to populate for 100 pages if your analytics and Search Console access are already in place.

  • URL, page purpose in one line, and the single action you want a visitor to take

  • Named owner, publication date, and date of last substantive edit

  • GA4 sessions, engagement rate, and counts for each relevant key event

  • Clicks, impressions, and average position from Search Console, since performance data only goes back 16 months

  • Automated accessibility findings, duplication notes, and any fixed deadline such as a campaign launch or funder report

Two of those columns do more work than the rest. Ownership tells you who can approve a change without a committee, and the key event column separates pages that move people from pages that merely receive them. Nonprofit content triage that ignores ownership produces a ranked list nobody is authorised to act on.

Build the scoring model

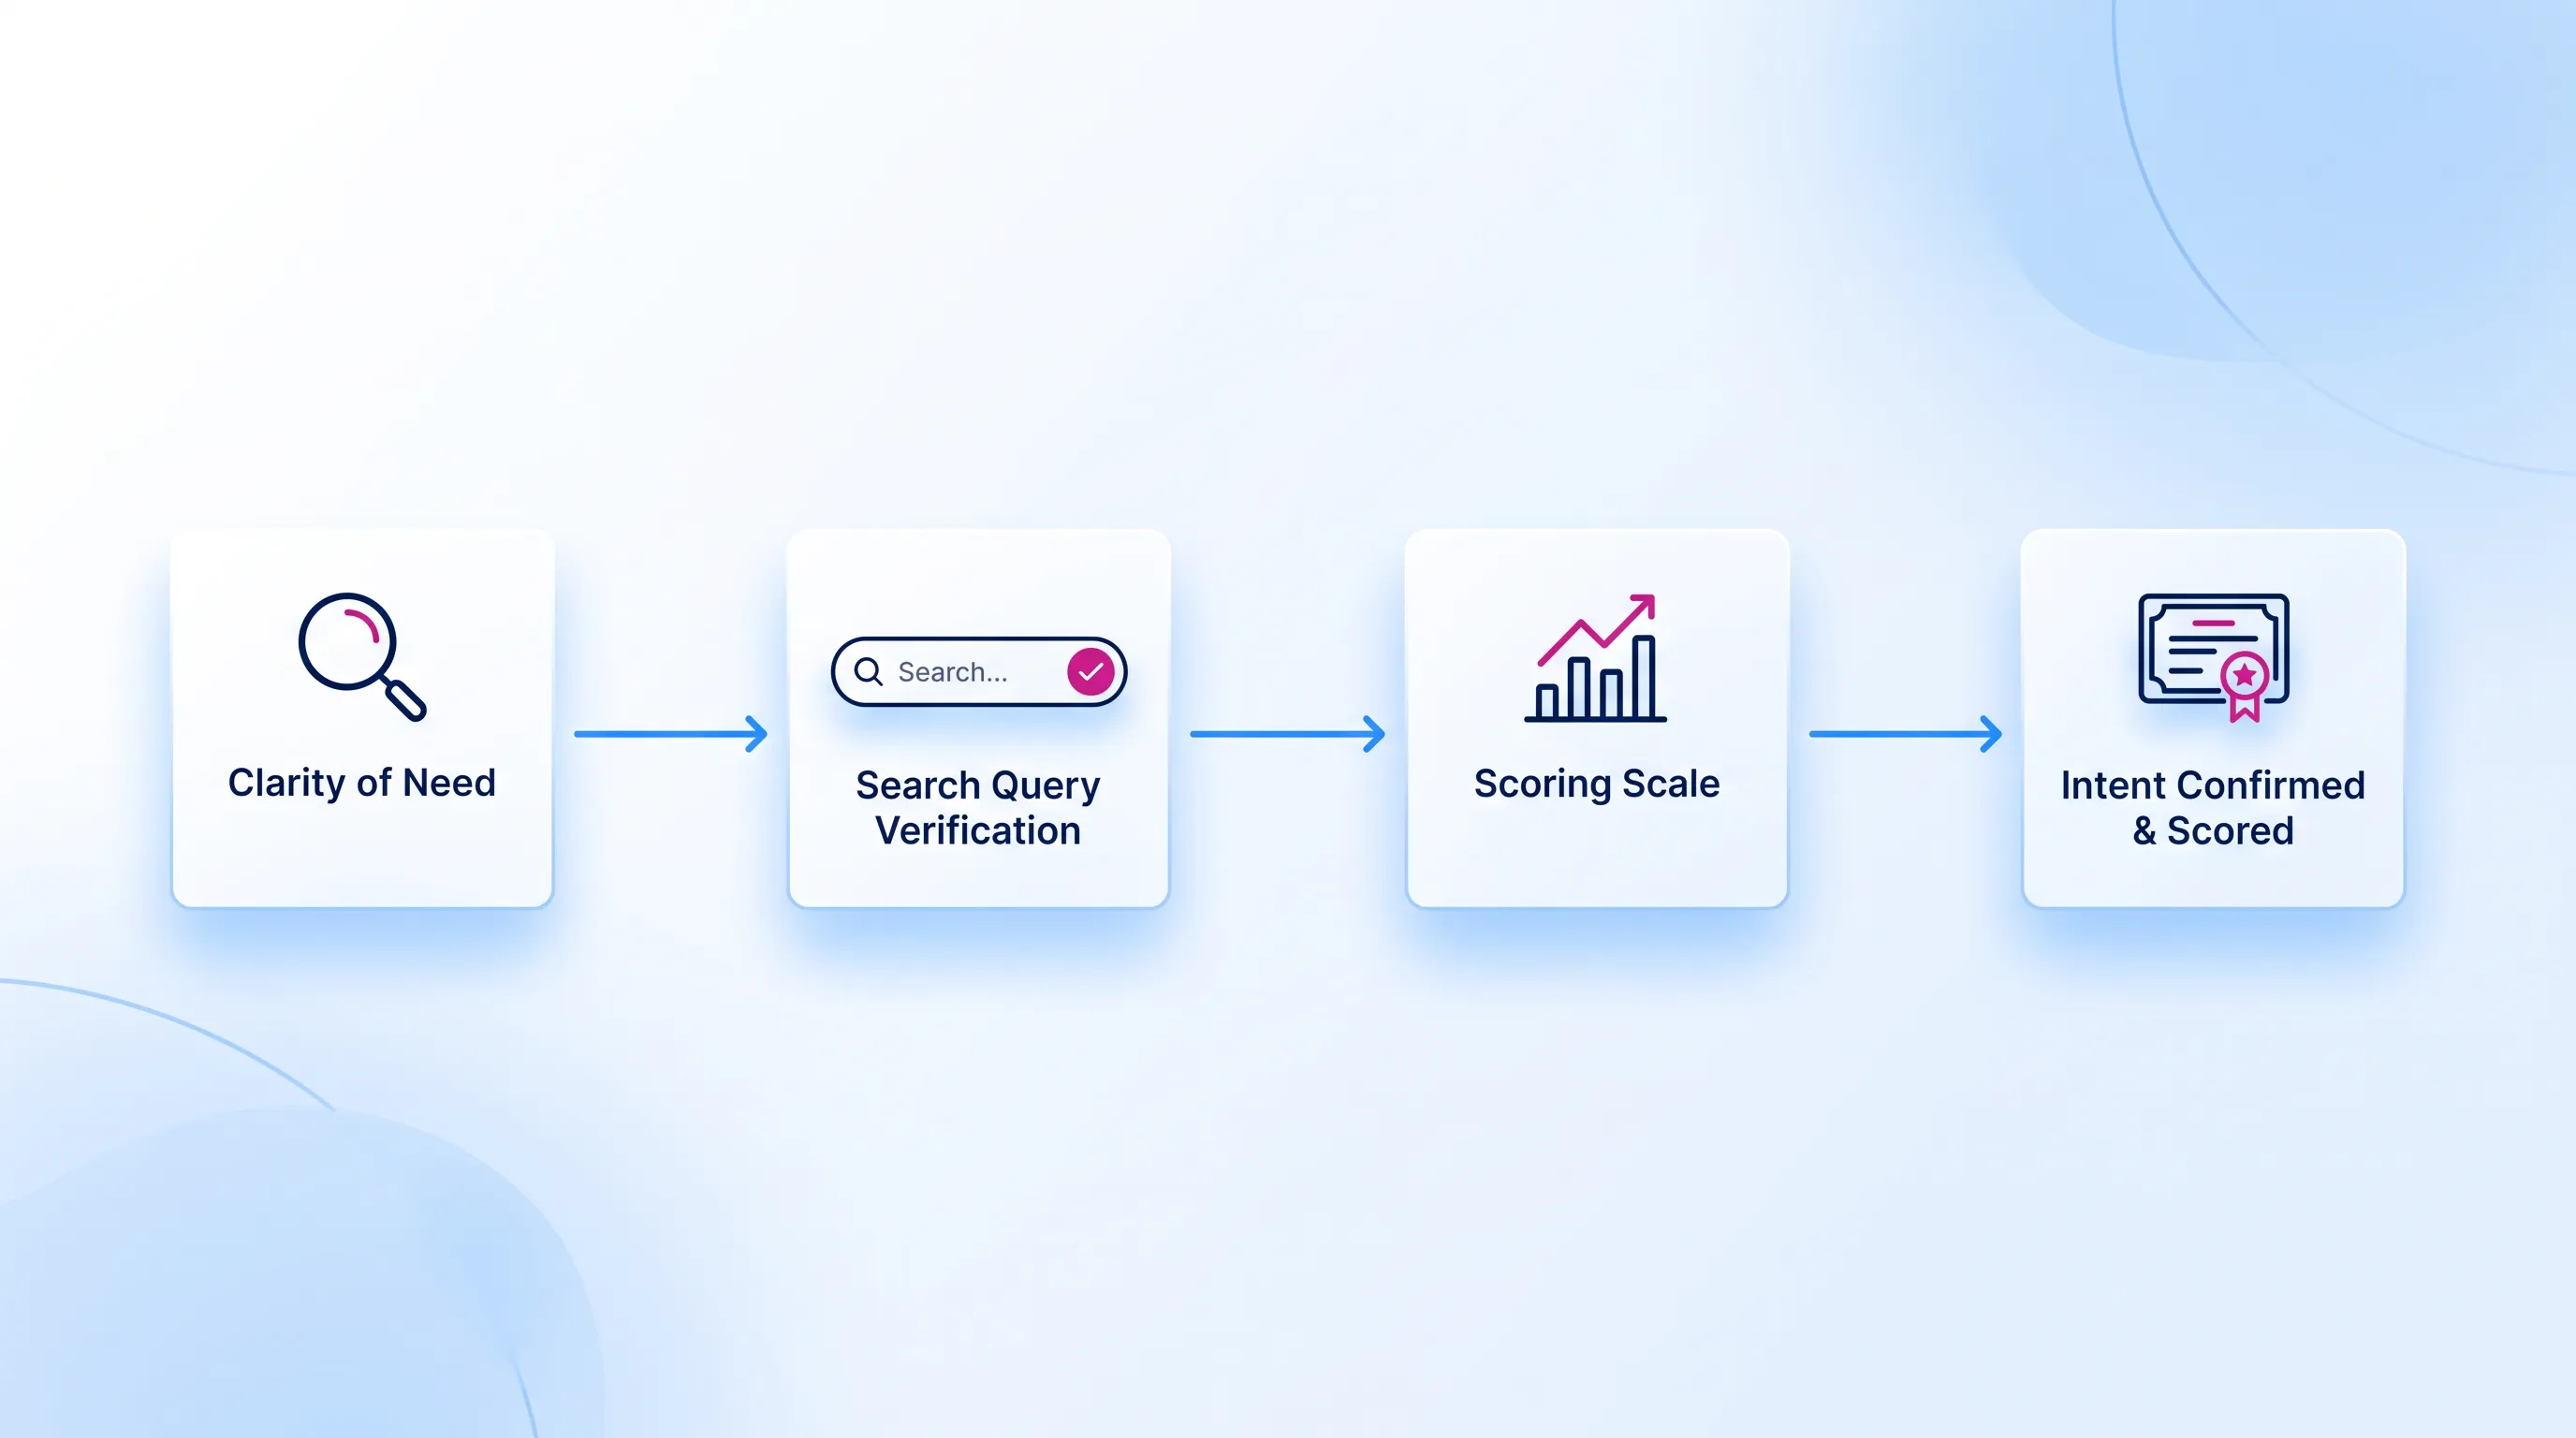
Four infographic containers titled "Clarity of Need", "Search Query Verification", "Scoring Scale", and "Intent Confirmed & Scored" arranged horizontally wit…

Use a 1 to 5 scale for every variable, where 3 is the honest middle. Each score needs a cell reference or a note explaining where it came from, which stops the exercise drifting into gut feeling by page forty. Five variables carry the model, and four of them combine into an impact score.

The suggested weights put user intent and strategic relevance at 30% each, with performance and quality gap at 20% each. Effort sits outside that sum and is used as a divisor later, which is what turns a scoring exercise into impact-effort prioritization. Teams can adjust the weights once, before scoring starts. Document the change in the sheet, then leave it alone, because nonprofit content triage that shifts mid-review produces rankings you can't defend to a programme lead in October.

User intent

Score how clearly the page answers a need you have verified through search queries or user research. A page written because someone in the organisation found the topic interesting scores 1 or 2 regardless of how well written it is. Pages that sit on a service journey, like eligibility criteria or how to apply, score 4 or 5.

Search Console query data is the cheapest verification available to you. If the queries bringing impressions to a page have nothing to do with its purpose, the intent score drops even when traffic looks healthy.

Need help with your AI visibility?

Book a free consultation with our experts we'll help you determine exactly which services your organization needs.

Performance

Qualified traffic matters more than raw sessions. Look at engagement rate and key event completions over the review period rather than a single month's number. M+R's analysis of nonprofit websites found that 1.6% of all visitors made a donation, which generated $1.33 per visit, so most pages will never look impressive on conversion alone.

Resist the temptation to equate low traffic with low value. John Mueller of Google has been direct about this: "I wouldn't remove it just because it doesn't get traffic." Safeguarding guidance read 200 times a year by the right 200 people outranks a listicle with 4,000 drive-by visits.

Strategic relevance

Rate how closely the page supports what the organisation is funding and running right now. Current programmes and safeguarding obligations push a page towards 5. A 2019 project summary that no restricted grant depends on sits at 1 or 2, even if it was once the most-read thing on the site.

Fundraising calendars belong in this score as well. Since nonprofits received 37% of online revenue in December, any page on the giving journey gains relevance from September onwards and loses it in February.

Quality and accessibility

Judge accuracy first, then authority and whether claims are backed by a source a sceptical reader could check. Duplication counts here too, because two half-updated pages on the same programme compete with each other and confuse the person reading them. Record the gap, not the current state, so a page scoring 5 is one that badly needs work.

Accessibility deserves its own column in the evidence sheet. WebAIM found that non-profit and charity home pages averaged 40.0 detected errors in its 2025 analysis, and the 2026 edition recorded low contrast text on 83.9% of pages across the million it tested. Most of those failures are text contrast and missing labels, which a content editor can fix without a developer.

Effort and urgency

Estimate effort in hours, then convert to the same 1 to 5 scale, where 1 means under an hour in the CMS and 5 means specialist or developer time. Note dependencies separately, because a page blocked on legal sign-off has a different shape of delay than one blocked on a photo. Urgency comes from fixed deadlines and from the harm caused by leaving the page as it is.

A wrong helpline number or a broken donation form causes harm every day it stays live. Those pages skip the queue, which the next section explains how to handle without breaking the model.

Apply impact-effort prioritization

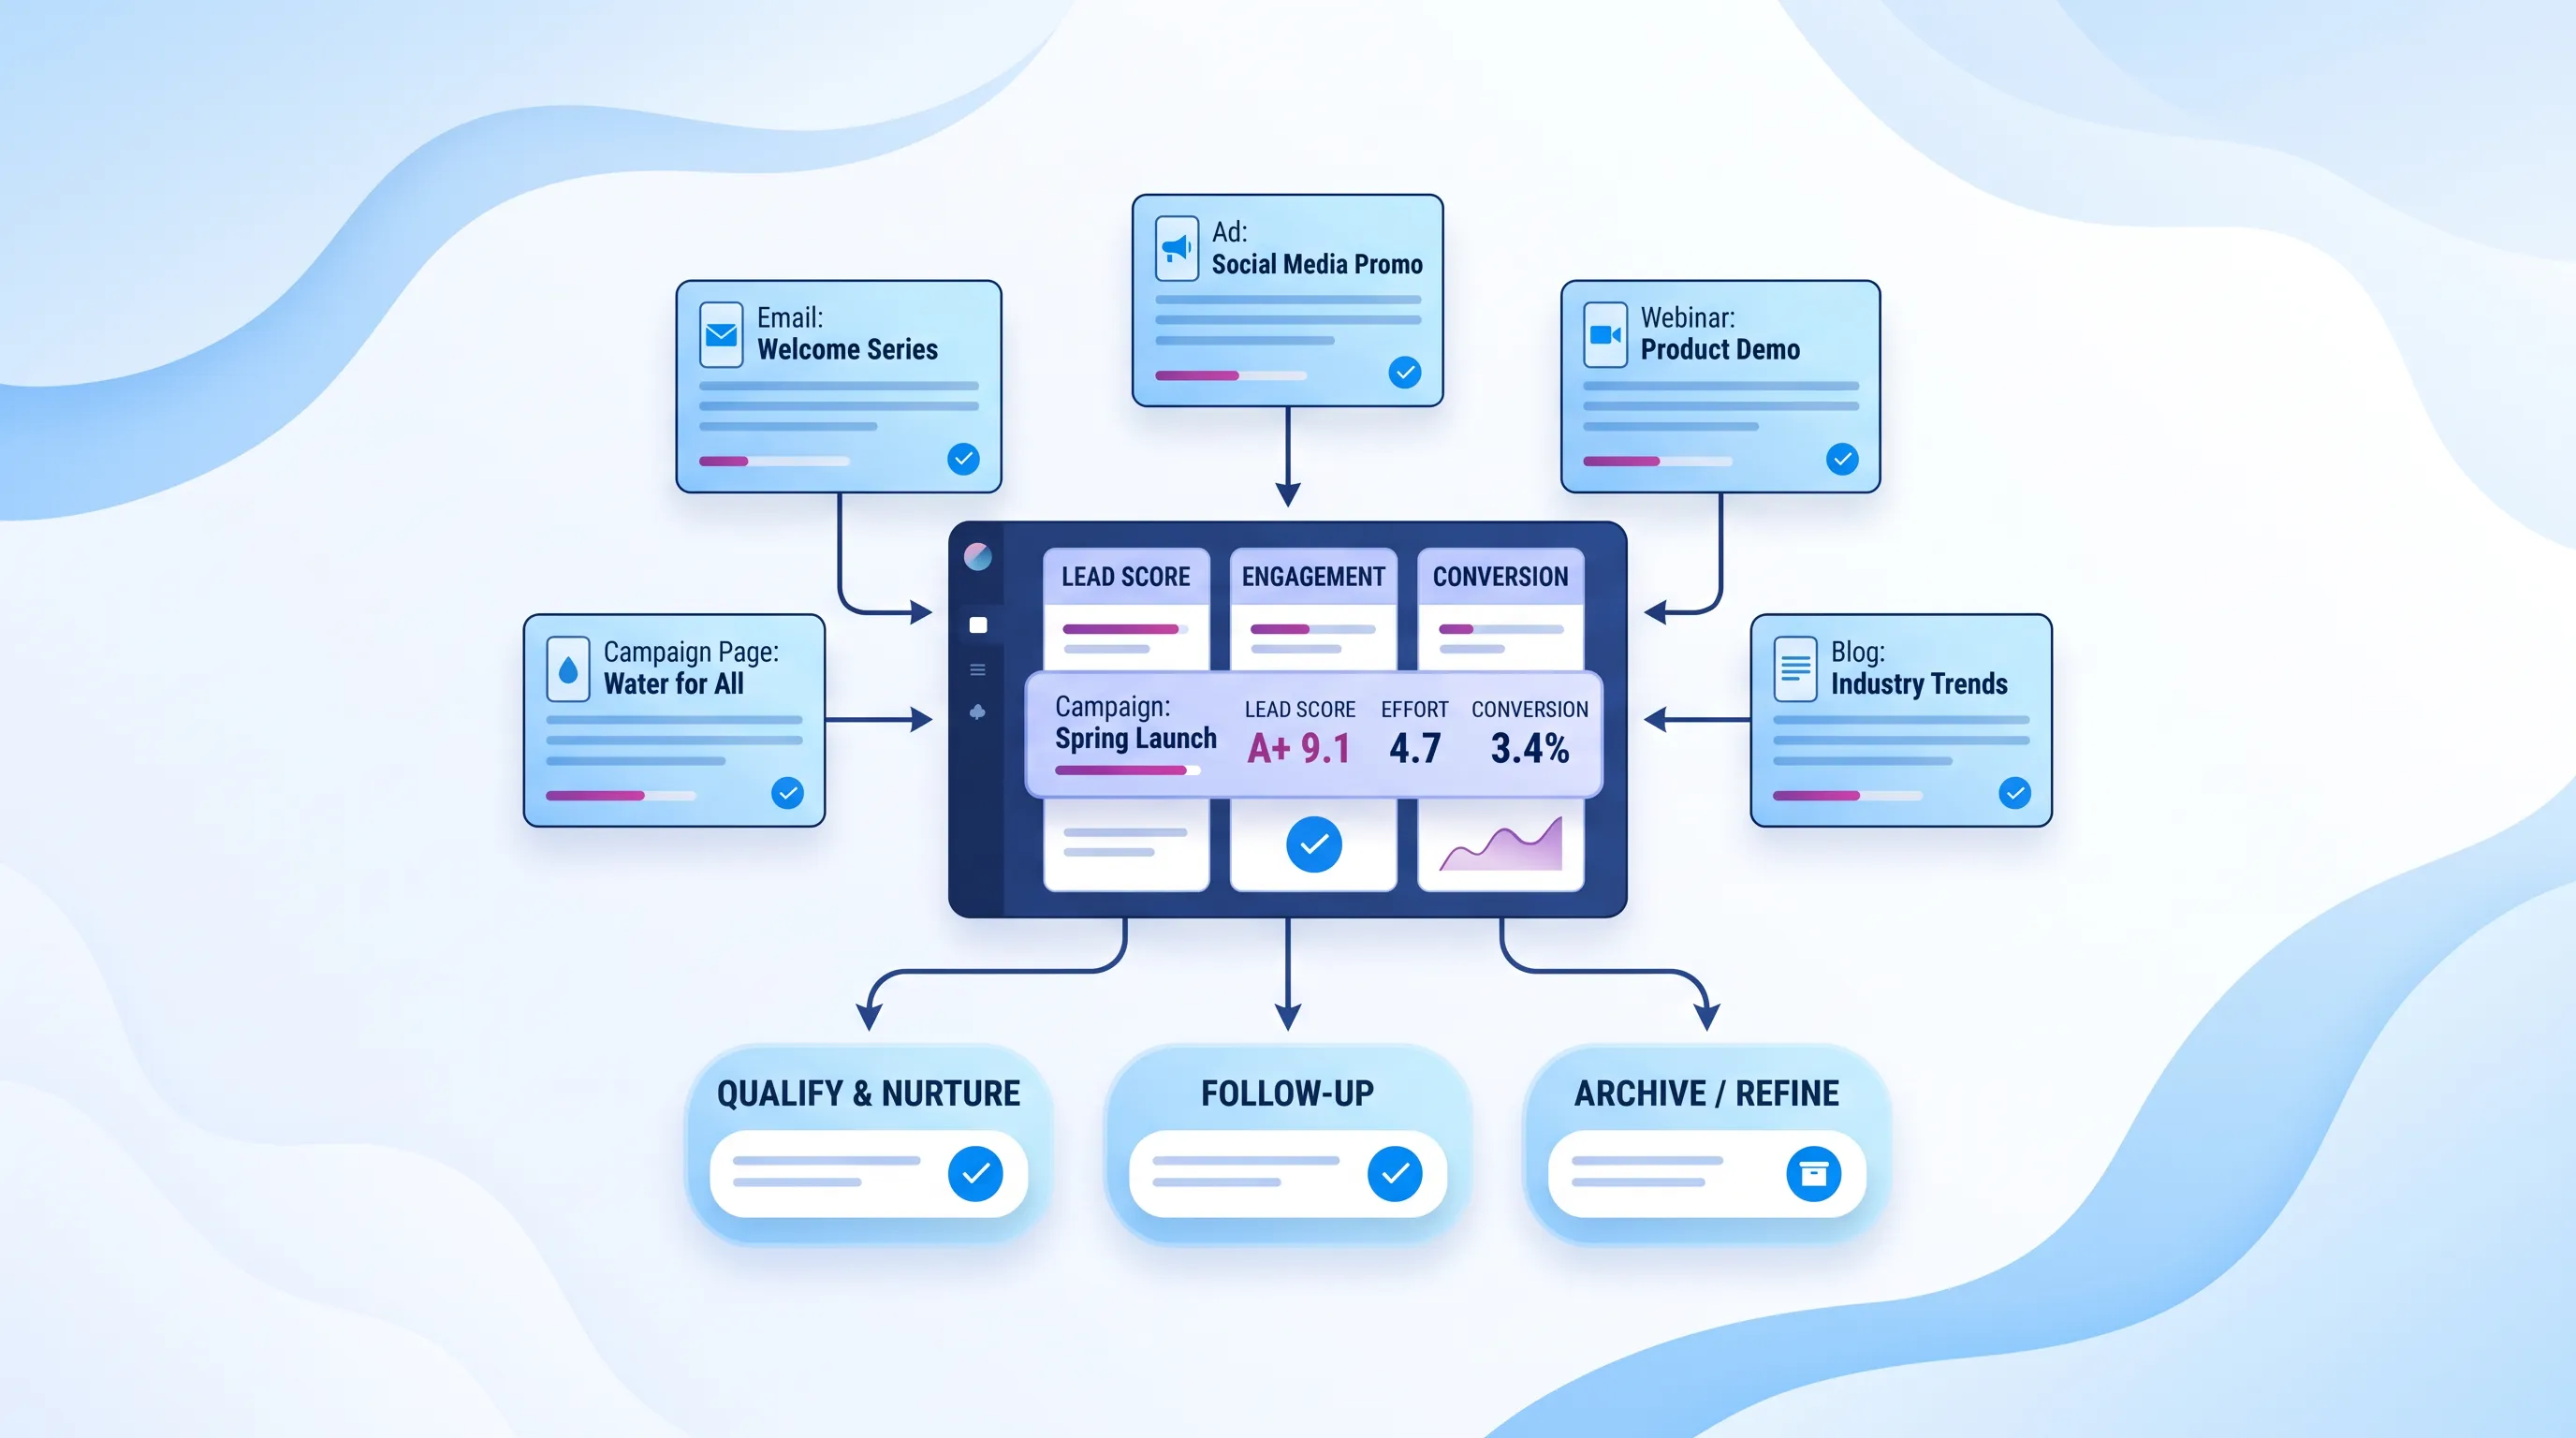
Calculate the impact score first: multiply each of the four impact variables by its weight and add them. Then divide by the effort score. A page scoring 4.2 on impact with an effort of 2 lands at 2.1, while a page scoring 4.4 with an effort of 5 lands at 0.88. The second page matters more in the abstract and still waits, because impact-effort prioritization ranks what you can finish this month.

Three bands keep the list readable. Anything above 1.6 goes into the active queue and 0.8 to 1.6 goes to the backlog with a review date. Anything below 0.8 is a candidate for merging or retirement. Those thresholds are a starting point for nonprofit content triage, and you'll adjust them after the first month once you see how many pages cluster at each level.

Overrides exist for risk. Factual errors and accessibility failures that block a core task go straight to the top with a note recording who decided and why. The UK government's monitoring programme found that 55.3% of issues were fixed once organisations were told about them, which tells you these corrections are small. Logging the override protects the model, since an unexplained jump to the front of the queue is how scoring systems lose credibility.

Need help with your AI visibility?

Book a free consultation with our experts we'll help you determine exactly which services your organization needs.

Choose the right action

A score is not a decision. Each band maps to one of six actions, and every row in the sheet gets exactly one, plus an owner and a deadline.

Here is the mapping that works for impact-effort prioritization at this scale:

  1. Refresh, for high-impact pages with low effort: update figures, sources, and the call to action, and keep the URL

  2. Rewrite, for high-impact pages where intent and the current text don't match

  3. Merge, where two or more pages compete for the same query and the same reader

  4. Redirect, when a merged or retired page holds links or still receives referrals

  5. Archive or unpublish according to something like the GOV.UK rule that guidance should usually be updated rather than withdrawn

  6. Leave as is, with a review date, which is a real decision and should be recorded as one

Deletion is the action to use sparingly. Mueller's advice in a 2021 Mediavine interview still holds: "it's better to improve content than to remove it", with scale as the honest exception. Nonprofit content triage earns its name by removing the pages that mislead or duplicate.

Work through an example

Take a live malaria prevention programme page, last substantively edited in 2022, with a donation key event configured and 310 sessions over 12 months. User intent scores 5, because Search Console shows the page collecting impressions for queries about how the programme distributes nets. Performance scores 2 and strategic relevance 5, with the quality gap at 4 since two statistics predate the current grant and the page repeats material from a campaign landing page.

The weighted impact score is 1.5 plus 0.4 plus 1.5 plus 0.8, which gives 4.2. Effort is 2, because the edits are copy and a clearer donation link inside the CMS. Priority is 2.1, comfortably inside the active band.

Compare it with two competing rows. A 2019 annual report page scores 1.7 on impact with effort of 1, so its priority is 1.7 and it moves to archive-with-redirect. A volunteer sign-up page scores 4.4 on impact but needs form rebuilding, which gives effort 5 and a priority of 0.88, so it goes to the backlog with a specialist flagged. The programme page goes first because nonprofit content triage rewards work you can finish and measure inside one cycle, and the same logic governs the model for content pruning across every other page in the set.

Run nonprofit content triage

Six hours a week splits cleanly. Spend 45 minutes reviewing and rescoring new rows and 30 minutes getting approvals moving. Spend three hours editing and one hour publishing and checking the live page. Batch two to four pages per week rather than ten, because partially edited pages are worse than untouched ones.

Keep the backlog visible to everyone who might need to unblock it. A shared board with three columns, one for each priority band, does the job, and it shows your head of programmes why the volunteer form has been waiting since March. This is where nonprofit content triage survives contact with the organisation, since the work that needs a developer is now a scheduling question.

Measure refreshed pages

Compare the 90 days after publication with the 90 days before, with key events as the primary measure. Donations and event registrations tell you whether the edit changed behaviour. HubSpot's own historical optimisation programme more than doubled monthly leads from the old posts it updated, with organic views up an average of 106%, so refreshed pages are worth measuring properly.

Organic numbers need context before you read them as success or failure. Ahrefs found that 96.55% of pages get no Google traffic at all, and Pew Research Center recorded click-through rates of 8% with an AI summary present against 15% without one. That gap is why generative search belongs in your measurement alongside GA4, and why nonprofit content triage now includes checking whether your pages are being cited at all. Snoika tracks mentions and citations across ChatGPT, Perplexity, and Google AI Overviews to show whether a refreshed page is feeding answers you never see in your analytics.

Keep decisions accountable

Review scores monthly against what actually happened, and check the weights quarterly. Record your effort estimate next to the hours the work really took, because that single comparison makes every future estimate sharper. Dates slip and programmes change, so a page scored 2 on relevance in June can be a 5 by November.

Snoika Foundation works with NGOs and public institutions on exactly this problem, from audit through publishing. Book a call with our team if you want help implementing nonprofit content triage or measuring how your pages perform in generative search.
Need help with your AI visibility?

Book a free consultation with our experts we'll help you determine exactly which services your organization needs.

Treat missing key events as a measurement gap, not as evidence that the page has no value. Check Search Console queries, page purpose, and owner feedback, then record a provisional score with a tracking deadline. This keeps nonprofit content triage moving while preserving the need to configure and test the right events.

Mark unavailable figures as missing instead of assigning a low score. Use the evidence you can verify, record the source, and flag the row for review after tracking is fixed. A dated note prevents estimated traffic or conversions from being mistaken for measured results during later scoring.

Merge pages when they serve the same audience, target the same search need, and repeat similar information. Keep the stronger URL, combine any unique useful material, and redirect the other page if it has links or visitors. Rewrite instead when each page serves a distinct task or audience.

Compare the 90 days after publication with the previous 90 days, using the same key events and traffic segments. Check donations, registrations, or another defined action before judging organic visits. Note campaign timing, seasonality, and tracking changes, because those factors can affect results without reflecting the edit.

Yes. Snoika Foundation works with NGOs and public institutions on content audits, publishing workflows, and measurement in generative search. If you need help setting up the spreadsheet, scoring process, or reporting routine, you can book a call with the team to discuss the work and its scope.

Book a Demo

Book a time that works best for you

You Might Also Like

Discover more insights and articles

Minimalist illustration of a nonprofit web page with structured content flowing to an AI interface, emphasizing citation-ready architecture.

Preparing Nonprofit Pages for AI Citation Opportunities

This article explains how to rebuild nonprofit web pages with citation-ready content architecture so that any short extract holds up on its own when an AI system pulls it out of context. It covers rewriting and a repeatable audit you can run with your existing editorial team.

A modern digital interface panel with a stylized browser window, surrounded by geometric trust icons on a soft blue gradient background.

Trust-First Copy Framework for AI Search Results

This article explains how to write educational content that holds up when an AI system summarises it and hands a condensed answer to someone who never visits your page. It sets out a four-layer trust-first content framework for sourcing and framing that content, plus a review sequence and the indicators worth measuring.

A polished SaaS dashboard with floating FAQ cards and a central AI search interface, set against a soft blue gradient background.

GEO-Focused FAQ Strategy for Nonprofits

This article explains how to apply NGO FAQ optimization to build an FAQ programme that answers the questions your stakeholders actually ask, in a form search engines and AI assistants can quote accurately. It covers research and clustering, then writing and schema. It also covers auditing and the measures worth reporting to your board.

Infographic with a glassmorphism style, featuring a 9-step process in three rows, with elegant blue-and-white icons and flowing connections.

How to Build AI-Ready Program Pages That Convert

This article explains how to rebuild a programme page as an AI-ready program page structure so that a prospective participant and a language model can work out in seconds what you do and whether it applies to them. It walks through a nine-block architecture and a publishing workflow you can run with a small team.