AI Visibility Score: What It Measures and How to Improve It

Content authorArtem LozinskyPublished onReading time11 min read
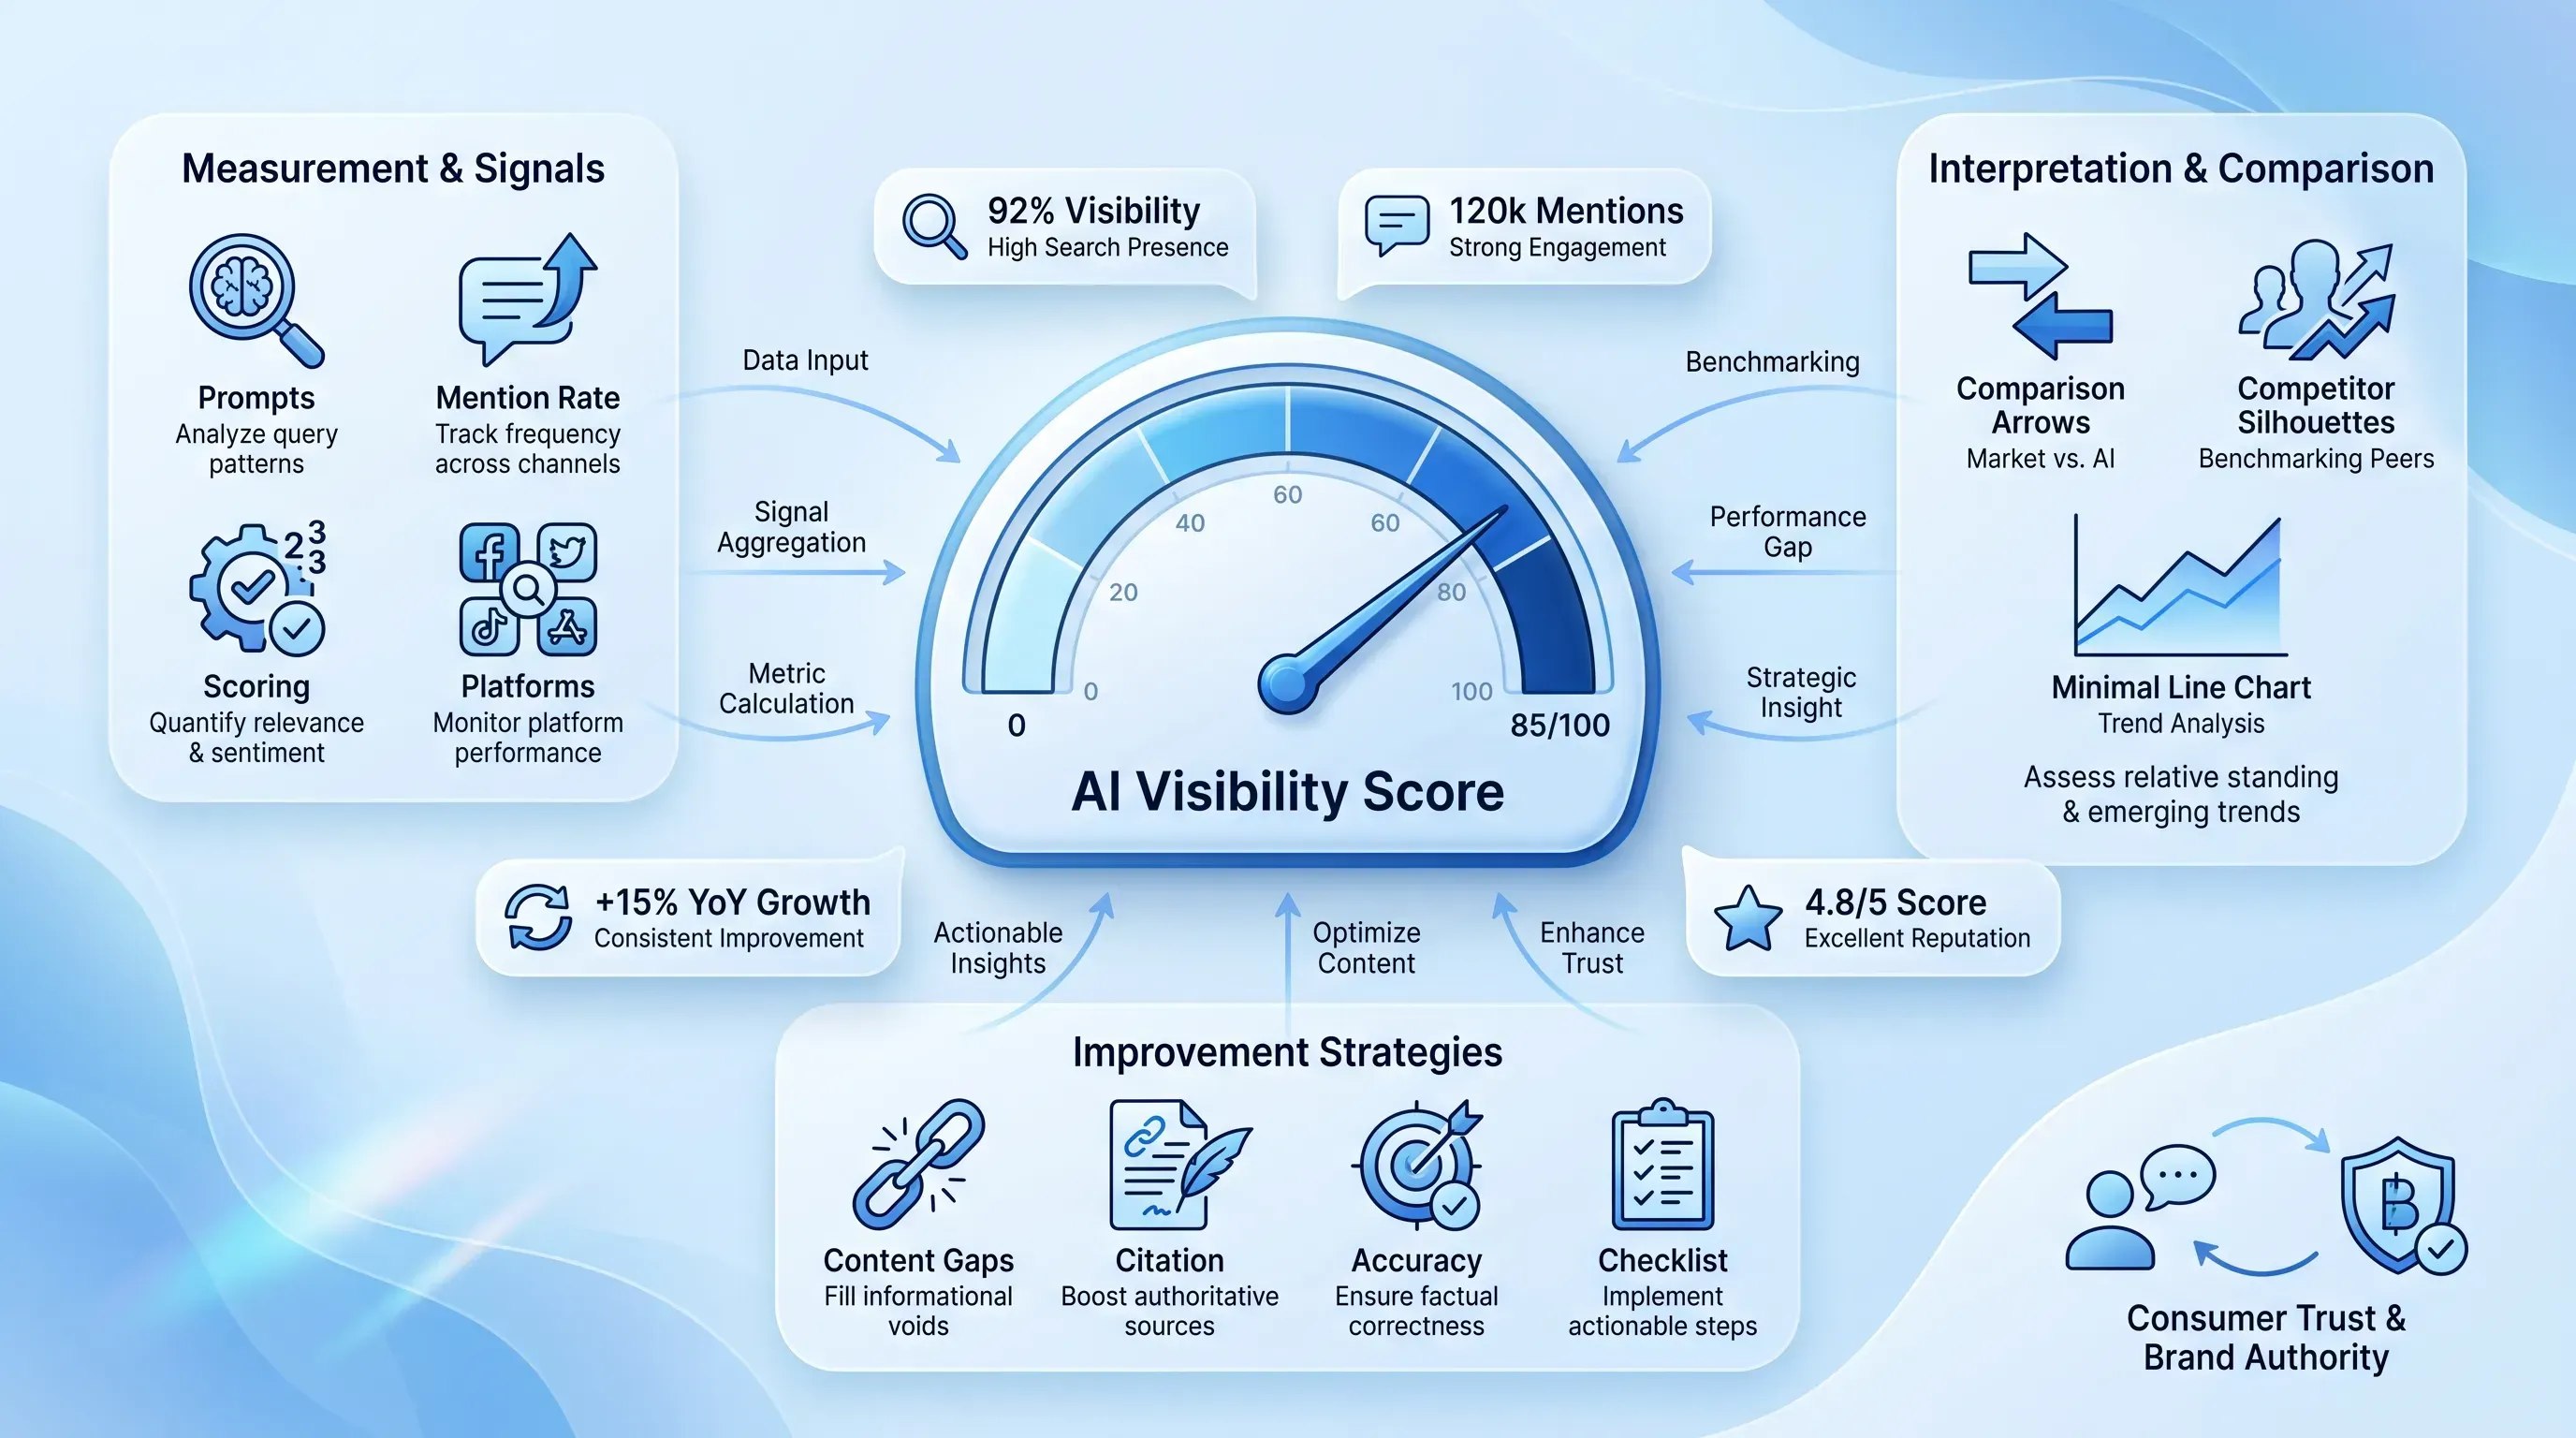
Modern infographic featuring a central 'AI Visibility Score' gauge surrounded by clusters for measurement, interpretation, and improvement strategies, on a s…

This article explains what an AI visibility score measures and why no two tools calculate it the same way. It also shows how to read its movement without overreacting. It then turns that reading into a short, prioritized plan for closing the gaps that matter to your buyers.

AI visibility score basics

An AI visibility score is a summary indicator of how present your organization is in AI-generated answers, and understanding it starts with knowing what it does and doesn't capture. The number reflects a selected set of prompts run across a chosen group of AI platforms. It rolls messy observations into one figure so you can watch a trend instead of reading hundreds of raw answers.

That's a different measurement from anything you know from traditional search. A rank tracks your position on a page of links. Traffic tells you who clicked through. An AI visibility score asks something else entirely: does your brand make it into the answer when someone asks a question in your category on an AI platform? The stakes are real, because 55% of U.S. consumers research products with AI at least weekly, according to a Semrush survey of over 1,000 shoppers.

So use the AI visibility score as a starting point. Before you act on any single number, you have to inspect its scope and the signals feeding it. A high score built on branded queries means something completely different from a high score built on competitive research prompts. The headline figure hides that distinction until you open it up.

How platforms calculate scores

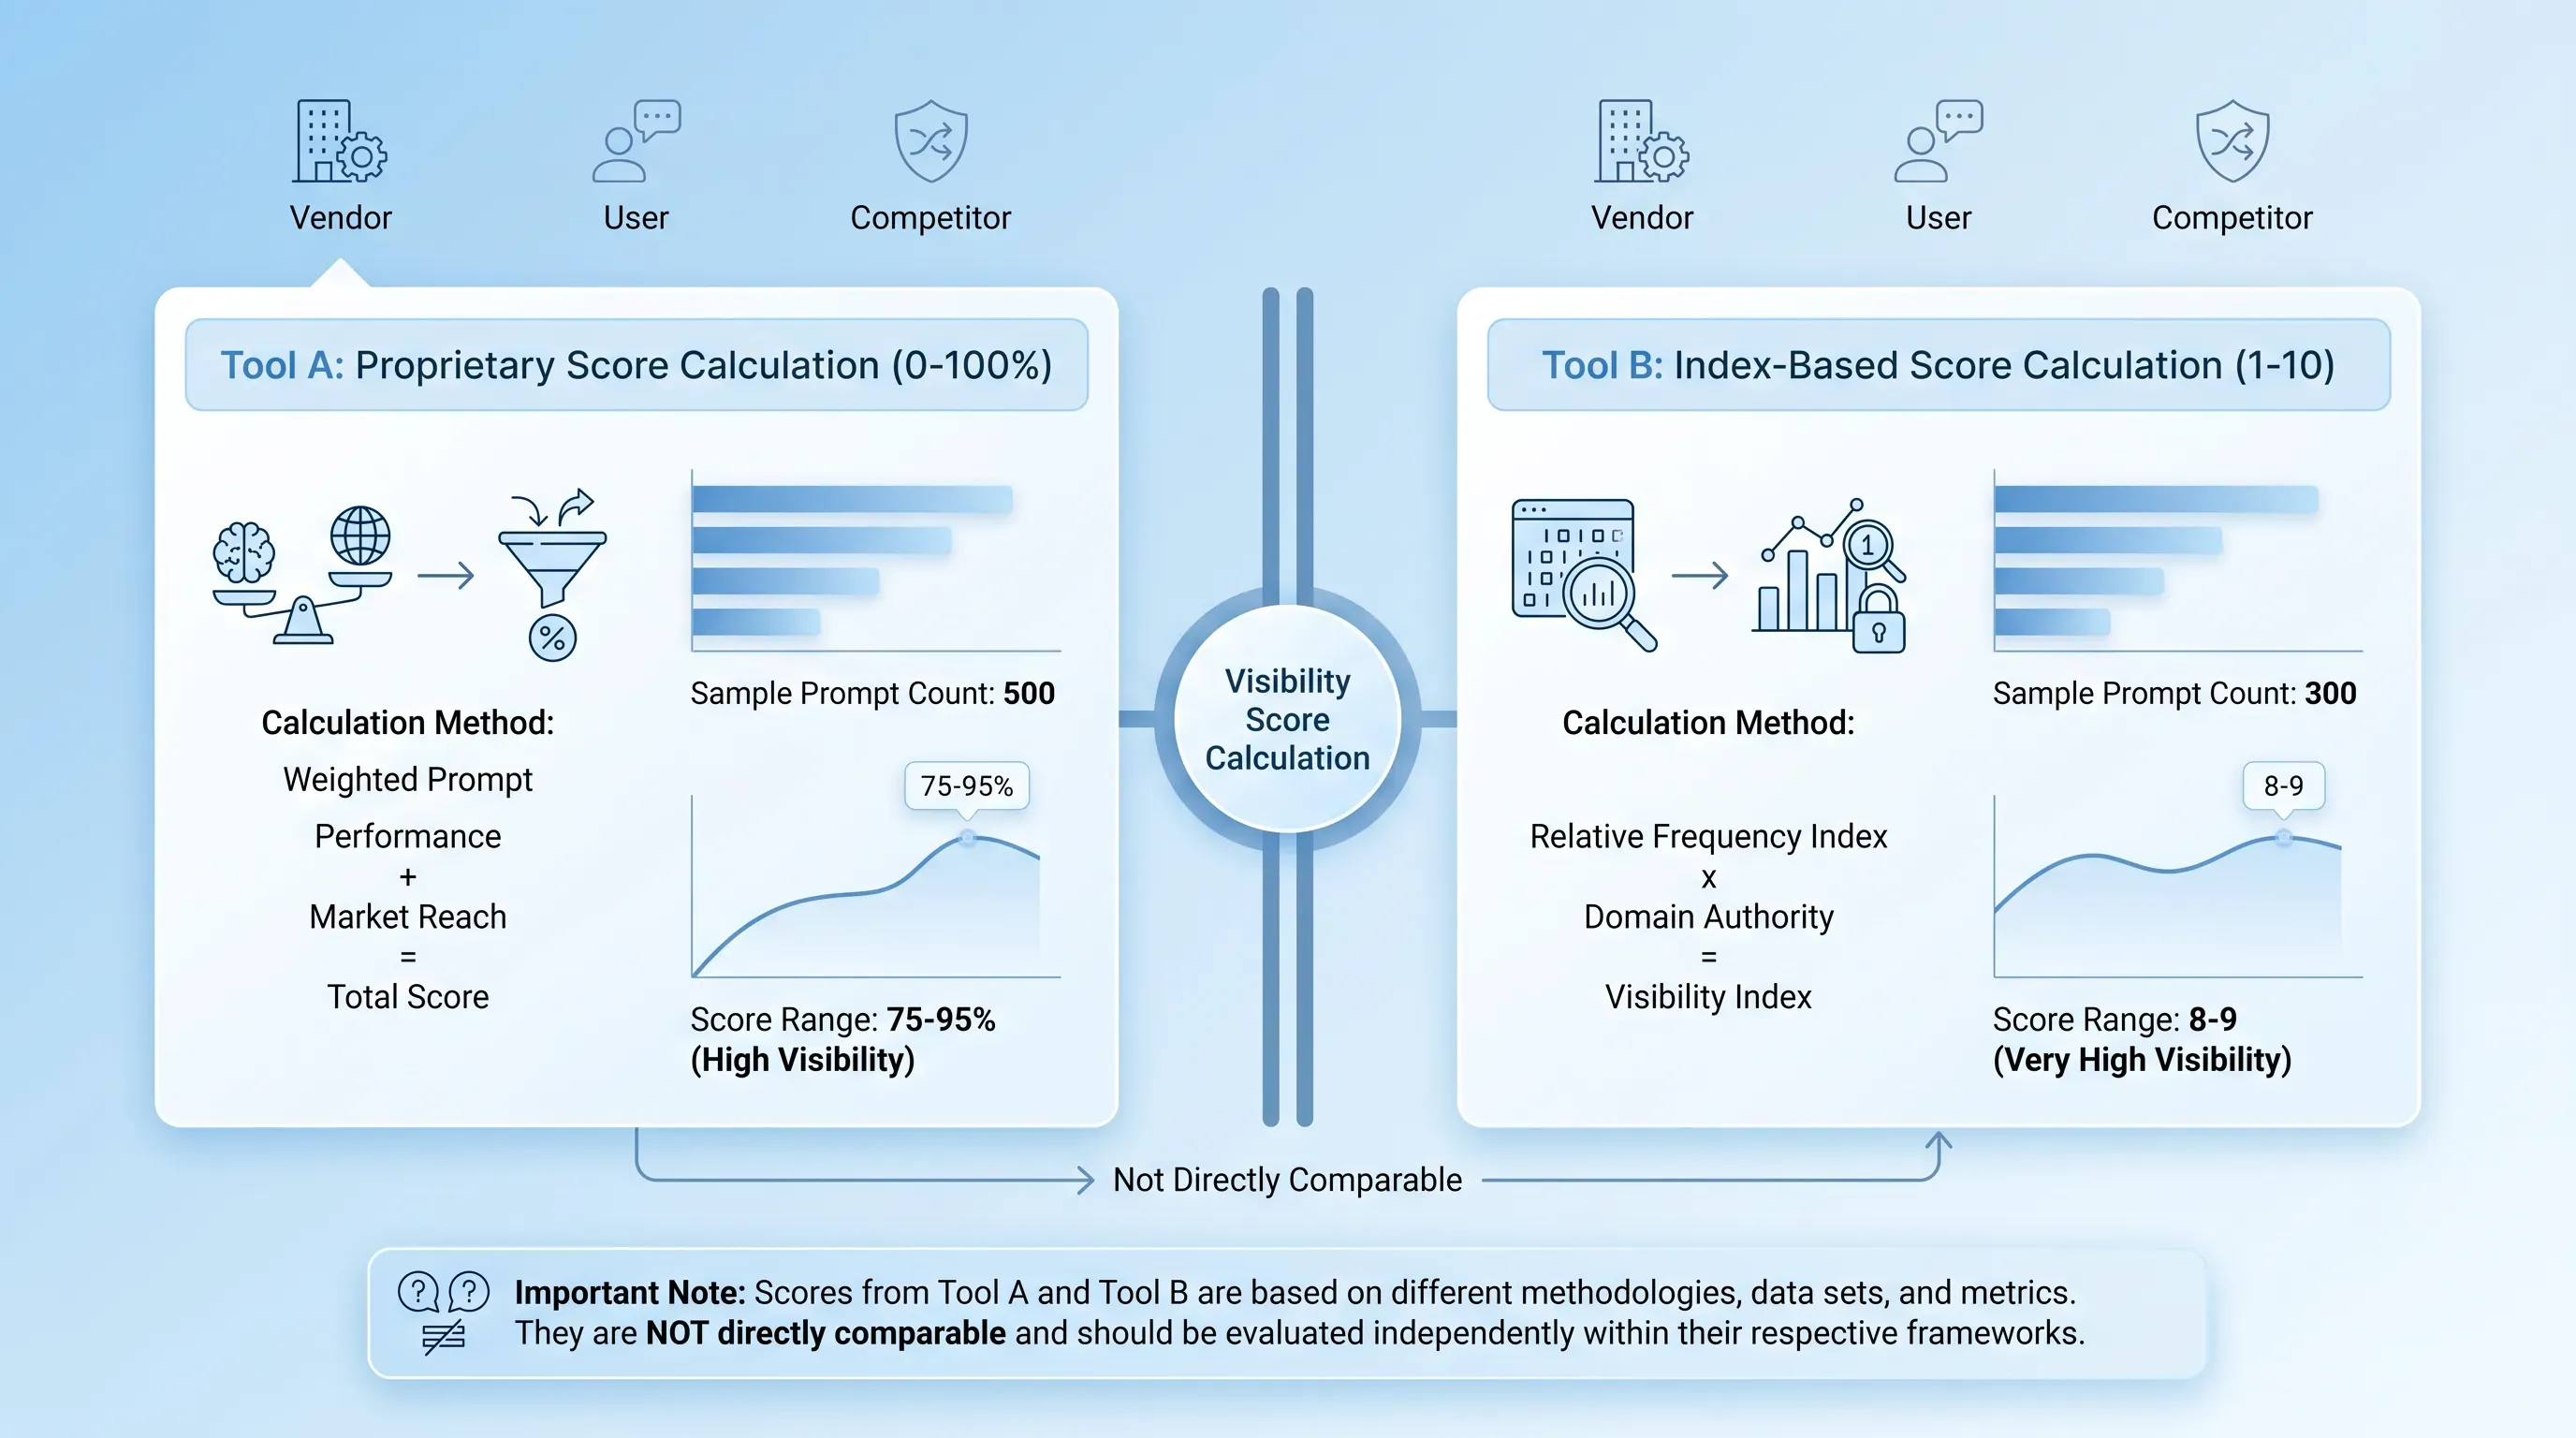
Calm infographic with two floating white cards for AI visibility checkers, featuring score methods, charts, and a central divider.

Here's the part that trips up anyone coming from conventional reporting: there is no standard industry formula for an AI visibility score. Two AI visibility checker tools can both hand you a clean number between 0 and 100 while measuring almost nothing in common. One samples five prompts on ChatGPT once a week. Another runs 500 prompts across four platforms daily. Same-looking scale, wildly different meaning.

Before you compare any two scores, or even trust one on its own, check what sits underneath it:

  • The tracked prompts and how many of them tie to real buyer research

  • The AI platforms included and how often each is sampled

  • The weighting rules and the competitor set the score is measured against

The calculation approaches below are models. Any given AI visibility checker picks one of these or blends them, so knowing which one you're looking at tells you how to read the result.

Simple mention rate

The most transparent model is a plain percentage. Run 100 test prompts, count how many answers name your organization, and the mention rate is your score. If your brand shows up in 22 of them, you score 22. Anyone with standard marketing analytics experience can follow that math in a second.

That clarity is the method's strength and its limit. A mention rate tells you the answer said your name. It does not distinguish between an appearance in the opening line and one buried in a footnote. It also does not assess the description's accuracy or whether a source was cited. Nor does it tell you whether the mention helped you at all. Presence and quality are separate things, and this model measures only the first.

Weighted brand visibility score

A more involved brand visibility score model assigns different weights to different signals before it normalizes everything into one figure. A mention counts for less than a citation. Being recommended by name counts for more than a neutral reference. The weighted total uses coefficients for answer position. It also accounts for factual accuracy and endorsement before becoming your brand visibility score.

Weighting adds useful nuance. A weighted brand visibility score tells you that you're mentioned often but rarely recommended, which a raw mention rate would hide. The trade-off is comparability. When you can't see how a vendor weights its inputs, you can't line their brand visibility score up against another tool's. That's why the accessible methodology matters more than the headline. Look for an AI visibility checker that shows you component-level results you can evaluate directly.

Need help with your AI visibility?

Book a free consultation with our experts we'll help you determine exactly which services your organization needs.

Competitive share model

The third model measures your appearances or citations as a share of all the visibility it tracks across your competitor set. If the tool watches you and three rivals across a prompt set, your score is your slice of the total pie of mentions.

This is where the math gets counterintuitive. Your score can fall even in a month when you earned more mentions than ever, because a competitor grew faster and took a bigger slice. The number moved, but not because you slipped. The competitor list and the prompt set decide the whole result here. Add a dominant rival to the tracked group and your share drops overnight, without anything changing about your actual presence.

Signals behind the score

Whatever model an AI visibility checker uses, it draws on a common pool of signals. Six signals recur in these scores, and reading your score well means knowing what each one reveals. These are common contributors. Any given tool includes only some of them or weights them in its own way.

Start with brand mentions. This is the rawest signal: did the answer name you? A prompt like "best project management tools for remote teams" that returns your product name means you cleared the first bar of discovery. Next comes source citations, a stronger signal because the AI pointed to a source backing the claim. Being named is not the same as being cited, and the gap between them is the gap between recognition and trust.

The remaining four sharpen the picture:

  1. Coverage across relevant prompts tells you how wide your presence is. Showing up for one query out of forty means a narrow footprint, even if that one mention is strong.

  2. Prominence within answers separates the brand in the opening sentence from the one listed eighth. On the note of prominence, only 20% of consumers say a brand stands out for appearing earlier, so clear description matters as much as position.

  3. Factual accuracy checks whether the AI described you correctly. A prominent mention that misstates your pricing or audience can cost you more than silence.

  4. Share relative to competitors places all of the above against your rivals, so a strong month still reads as a loss if they gained faster.

Walk a buyer-research prompt through these and the logic connects. "Which CRM integrates with Shopify" tests discovery through mentions. "Compare the top three CRMs for small e-commerce" tests consideration through prominence and accuracy. A follow-up asking which one is most recommended tests trust through citations and competitive share.

Read score changes correctly

A score that moved is not automatically a score that told you something. The first rule of reading movement is comparing like with like. Use the same prompt set and the same measurement cadence. Keep the platforms, geography and model access, and competitor group consistent. Change any one of those between reports and the delta reflects your measurement.

Then there's the nature of the systems themselves. AI answers vary between runs, even for identical prompts. A Washington State University study led by marketing professor Mesut Cicek found that across ten identical prompts, ChatGPT gave consistent answers only 73% of the time. "If you ask the same question again and again, you come up with different answers," Cicek said. A breast cancer treatment study reported the same instability, with 68% of cases showing variable content across repeated identical prompts. So a single jump or drop never triggers a strategy change on its own.

What you're hunting for is a sustained pattern across repeated measurements, and the cause behind it. When the score moves, identify the driver. Check the component and topic cluster first, then determine whether a platform or competitor caused it.

Two of the most common misleading changes are worth naming:

  • A score climbs because someone added branded prompts to the set. The result reflects easier questions and provides no measure of your visibility on real buyer questions.

  • Your competitive share falls while your mentions hold steady or rise. A rival grew faster, which is worth knowing, but it isn't the same problem as losing ground yourself.

Need help with your AI visibility?

Book a free consultation with our experts we'll help you determine exactly which services your organization needs.

Improve AI visibility score

Improvement starts with diagnosis. Before you write a word of content or chase a single citation, find your weakest AI visibility score component and the high-value prompts where that weakness costs you most. A brand that's mentioned everywhere but described inaccurately has a different problem from a brand that's absent from every comparison query. Fix the wrong one and the number won't move.

The recommendations below are organized by the problem they solve, so you can build a focused backlog rather than a scattered to-do list. Each one connects to a specific input behind your AI visibility score. Work them in the order your diagnosis dictates.

Close prompt coverage gaps

Find the commercially relevant prompts where competitors appear and you don't. These are the questions buyers actually ask when they're researching a purchase, and every one you're missing is a decision happening without you in the room. Given that 43% of consumers have discovered a new brand through AI, an absent brand loses discovery it never sees.

The fix is content that directly answers those topics and explains your relevant offering or expertise in clear, intent-matched terms. Prioritize prompts tied to genuine customer research and decisions. Padding the score with easy branded queries where you already win moves the headline number without winning you a single new buyer.

Earn stronger citations

Citations rise when your claims are easy to verify. Original data and named experts with real credentials give an AI something concrete to point at. Clear definitions and current statistics do the same. Vague marketing copy gives it nothing to cite. Well-supported product and service information can turn a possible mention into a sourced one.

The work doesn't stop at your own site. AI answers pull from reputable third-party sources such as reviews and directories. Industry publications also feed directly into citation frequency and source prominence. A mention in a trusted industry roundup can carry more weight in an answer than a page on your own domain. Build the outside signals alongside the on-site ones.

Correct inaccurate answers

Compare what the AI says about you against the authoritative facts. Check its description against what's true about your products and locations. Also verify what it says about your audience and pricing, along with its account of your capabilities. Contradictions are common, and they spread quickly across the web.

Resolve them at the source. Align your owned pages with your structured business information. Make sure your profiles on trusted platforms match the third-party references the AI is reading. Accuracy work can raise the value of your visibility even when your mention volume holds flat, because a correct, prominent description converts where a wrong one repels. The count stays the same while the quality climbs.

Strengthen competitive presence

Review the prompts where rivals receive recommendations or hold more prominent positions than you. Read those answers closely to identify the reason. Common reasons are a missing comparison criterion or an unaddressed use case. Others include a proof point you never published or independent validation you lack. Adobe found that 38% of shoppers already use generative AI for online shopping, so the comparison stage is live and consequential.

Address those specific gaps rather than copying competitor content. And stay focused on the rivals who affect your relevant competitive share. Chasing every brand in the category spreads your effort thin and drags your attention toward prompts your real buyers never ask.

Check your AI visibility score

Before you pick any of that work, get a baseline. An AI visibility checker shows you where you appear today and where the gaps sit, which is the only honest starting point for deciding what to fix first. Snoika's free AI Visibility Report measures your presence on major AI platforms, including ChatGPT and Google AI Overviews. It also covers Perplexity and other platforms, then benchmarks it against competitors so you can see where rivals are winning.

Save the report's date and scope. Then pick one or two underlying weaknesses to work on and rerun a comparable report once your changes have had time to register. That discipline is what turns a single AI visibility score into a trend you can actually steer.
Need help with your AI visibility?

Book a free consultation with our experts we'll help you determine exactly which services your organization needs.

Track branded and nonbranded prompts in separate groups. Branded prompts test whether AI systems recognize a name already known to the searcher, while nonbranded prompts show whether it appears during category research. Report each group independently, since a combined ai visibility score can conceal weak discovery performance.

Use prompts drawn from sales conversations and on-site search terms, then remove questions unrelated to a purchase decision. Include a comparison prompt when buyers compare options, and include an integration prompt when compatibility affects their choice. Label each prompt by buyer stage so changes can be traced to a decision context.

No. It measures presence in a defined sample of AI answers, not purchases or revenue. Pair it with conversion data from your own analytics and manual reviews of the answers. A rising score matters commercially only when the tracked prompts reflect buyer research and the descriptions are accurate.

Save the full answer alongside its prompt and measurement date. Keep the platform and location settings in the same report record. These examples let you verify whether a score shift came from real coverage change or answer variation. They also document inaccurate claims that need correction.

Create a dated change log after each Snoika report. Link each content edit or profile correction to the affected prompts, then wait until the next comparable measurement before judging it. This record won't prove causation by itself, but it helps separate your work from platform variation or competitor changes.

Book a Demo

Book a time that works best for you

You Might Also Like

Discover more insights and articles

An airy infographic featuring a central 'Trust' card surrounded by translucent strategy steps, metrics, and icons on a blue gradient background.

Nonprofit Brand Strategy: A Step-by-Step Framework for Building Trust

This article lays out a reusable framework for defining what your organization stands for and proving your claims with evidence. It covers research through measurement.

Calm infographic showcasing 'Tailored AI Training for Nonprofit Staff' with role-specific cards and best practices in a clean layout.

AI Training for Nonprofits: A Practical Curriculum for Teams

This article lays out a curriculum for turning scattered AI experiments across your staff into shared, documented practice. It covers how to assess skills and risks and design role-specific learning.

Infographic illustrating the nonprofit donor journey with rounded cards for each stage, set against a light blue to white gradient background.

Donor Journey Mapping for Nonprofits: From First Contact to Long-Term Support

This article gives you a practical framework for donor journey mapping, from the moment someone discovers your cause through recurring support and advocacy. You will learn how to pick a priority persona and map each stage of the nonprofit donor journey. The finished map then becomes a guide for coordinated fixes across your website and email, with search and campaigns folded into the same effort.

A light blue infographic featuring a central translucent card labeled 'AI Policy for Nonprofits' with branching flowcharts and stakeholder silhouettes.

AI Policy for Nonprofits: A Practical Governance Template

This article walks you through building an AI policy for nonprofits based on what your staff already do. You'll get plain-language principles and use boundaries, with safeguards built into a copy-ready template and an implementation checklist you can adapt this week.