How to Measure Generative Engine Optimization: A Practical GEO Framework

Content authorArtem LozinskyPublished onReading time11 min read
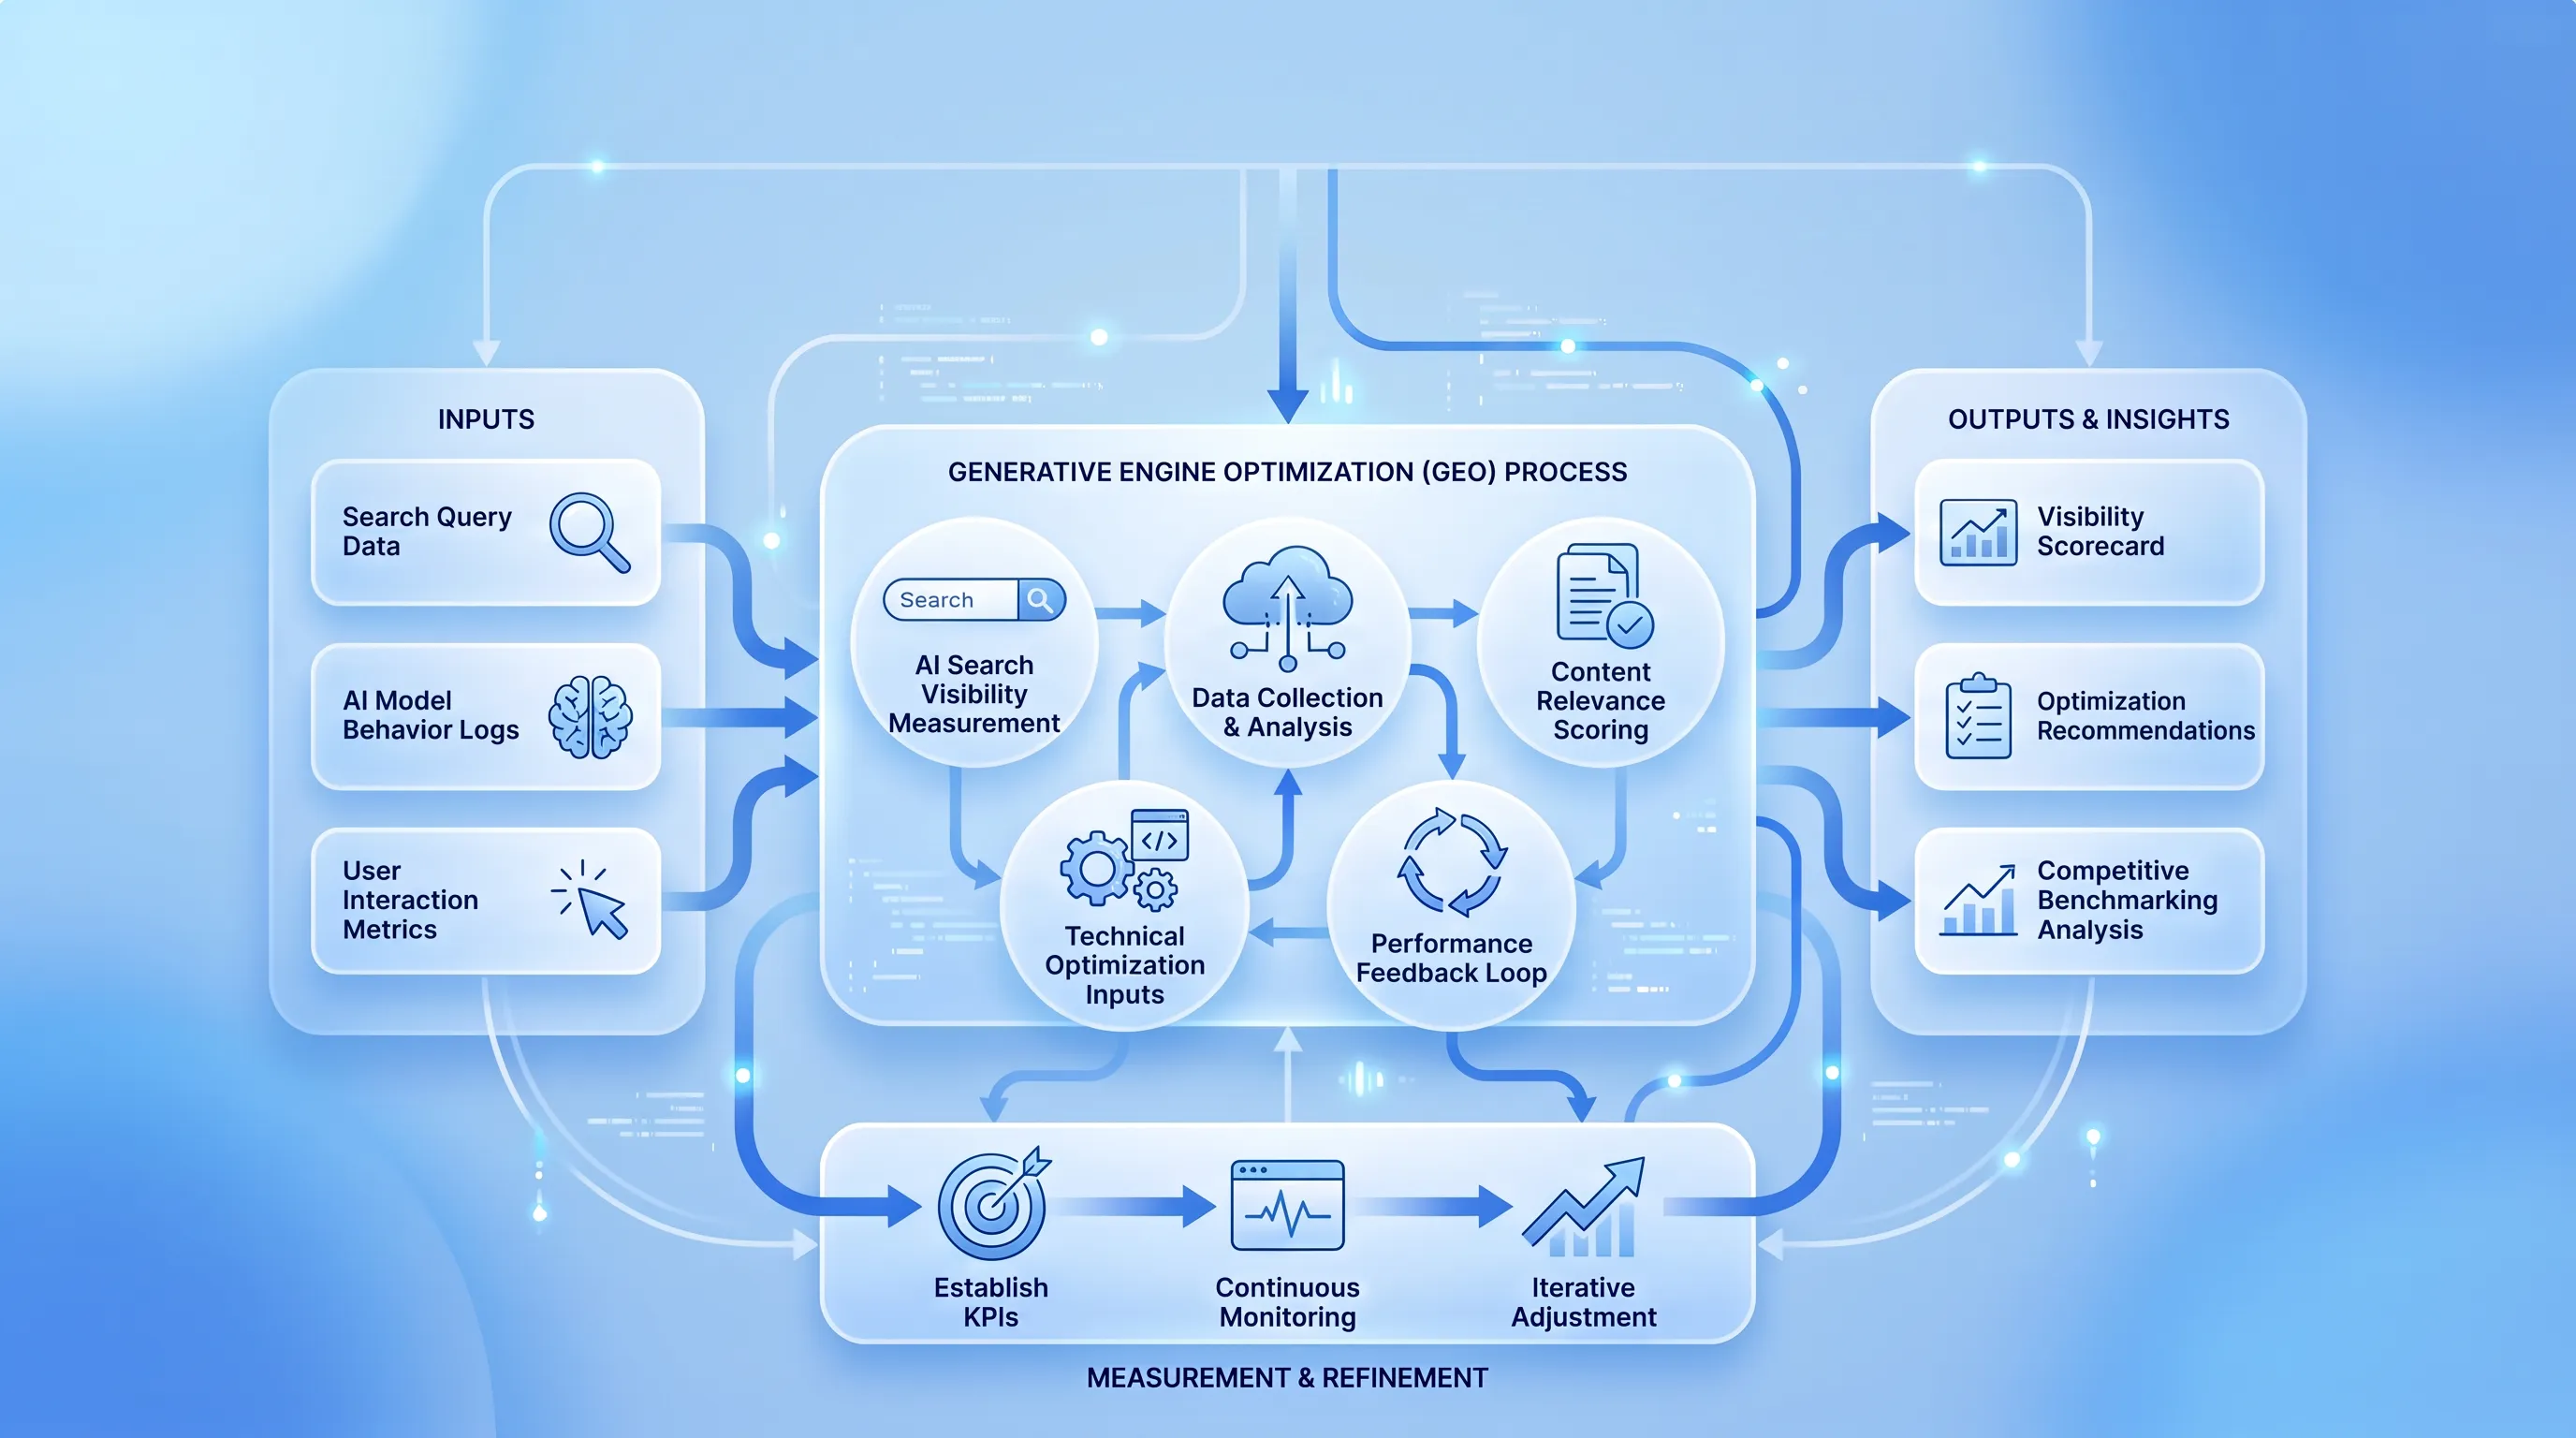
A clean, modern vector illustration of interconnected diagrams and flowcharts in soft blues and whites, depicting data processes without a title.

This article on how to measure generative engine optimization lays out a repeatable way to measure whether your work on AI answer visibility is producing results. It covers prompt sets and platform coverage, then the tracking and dashboard that hold it all together.

Why one score fails

If you've started optimizing for AI answers and can't yet prove it worked, the problem is rarely effort. It's that most teams learning how to measure generative engine optimization reach for a single number, and a single number can't describe what generative systems actually do. Answers change between sessions. Citations come from pages that never ranked. SE Ranking ran 10,000 keywords through Google's AI Mode three times in one day and found the average URL overlap was 9.2%, with no shared URLs at all in 21.2% of cases.

Composite "visibility scores" hide that volatility behind a smooth line. They also blend measures that need different responses. Weak citation rates call for authority work. Wrong facts in an answer call for content correction. Both problems disappear inside one index.

How to measure generative engine optimization

The sequence below on how to measure generative engine optimization is deliberately boring, because measurement that survives a quarterly review has to be boring. You define a fixed set of prompts on the platforms your buyers actually use and record what happens before you change anything. Then you track visibility and answer quality separately and connect what you can to revenue.

Each step feeds the next. Skip the baseline and you'll spend the next review arguing about whether a rise in mentions came from your content or from a model update. Skip the business layer and you have a report nobody outside the team can read.

  • Define a representative prompt set and freeze a core group of it.

  • Choose two to four platforms based on where your audience asks questions.

  • Record a baseline across those prompts and platforms before the campaign starts.

  • Track visibility and answer quality as separate metric families.

  • Tie results to sessions and pipeline where attribution allows.

  • Re-run the same prompts on a fixed schedule and compare like with like.

Build your prompt set

Prompts are your unit of measurement for how to measure generative engine optimization, the way keywords once were. Start with branded prompts ("is [brand] good for enterprise teams") and unbranded category prompts ("best payroll software for 30-person agencies"), because the two behave differently. A brand can hold high mention rates on branded prompts while being invisible on the unbranded ones that decide a shortlist.

Cover the funnel deliberately. Early prompts describe a problem without naming a solution category. Mid-funnel prompts compare options. Late prompts ask about pricing or implementation. Add location variants if your buyers are regional, because AI answers shift with geography even when the wording doesn't.

Document every prompt in a spreadsheet with its exact text and the date you added it. Keep a stable core of 30 to 50 prompts you never change, then a rotating set you can expand as new questions appear. The stable core is what makes generative search measurement comparable over time. Everything else is exploration.

Choose platform coverage

Coverage should follow your audience. ChatGPT reported 800 million weekly active users at OpenAI's DevDay in October 2025, which makes it the default first platform for most categories. Google AI Overviews matter for a different reason: BrightEdge found AI Overviews appearing on roughly 48% of tracked queries, up from about 30% a year earlier. Gemini and Perplexity earn a slot when your own referral data or customer interviews say they do.

Testing conditions matter as much as platform choice. Use the same country and language settings, the same account state (logged out is easier to reproduce), and record the model version with every run. Mike King, founder of iPullRank, put the sequencing plainly in an AirOps webinar: start with Google surfaces because Google controls the broadest ecosystem, then use clickstream and audience data to decide whether ChatGPT or Perplexity deserves extra focus.

Two well-instrumented platforms beat five sloppy ones. If you can't hold conditions steady on a platform, its numbers will move for reasons you can't explain, and any GEO metrics you pull from it will be noise dressed as signal.

Need help with your AI visibility?

Book a free consultation with our experts we'll help you determine exactly which services your organization needs.

Track the right metrics

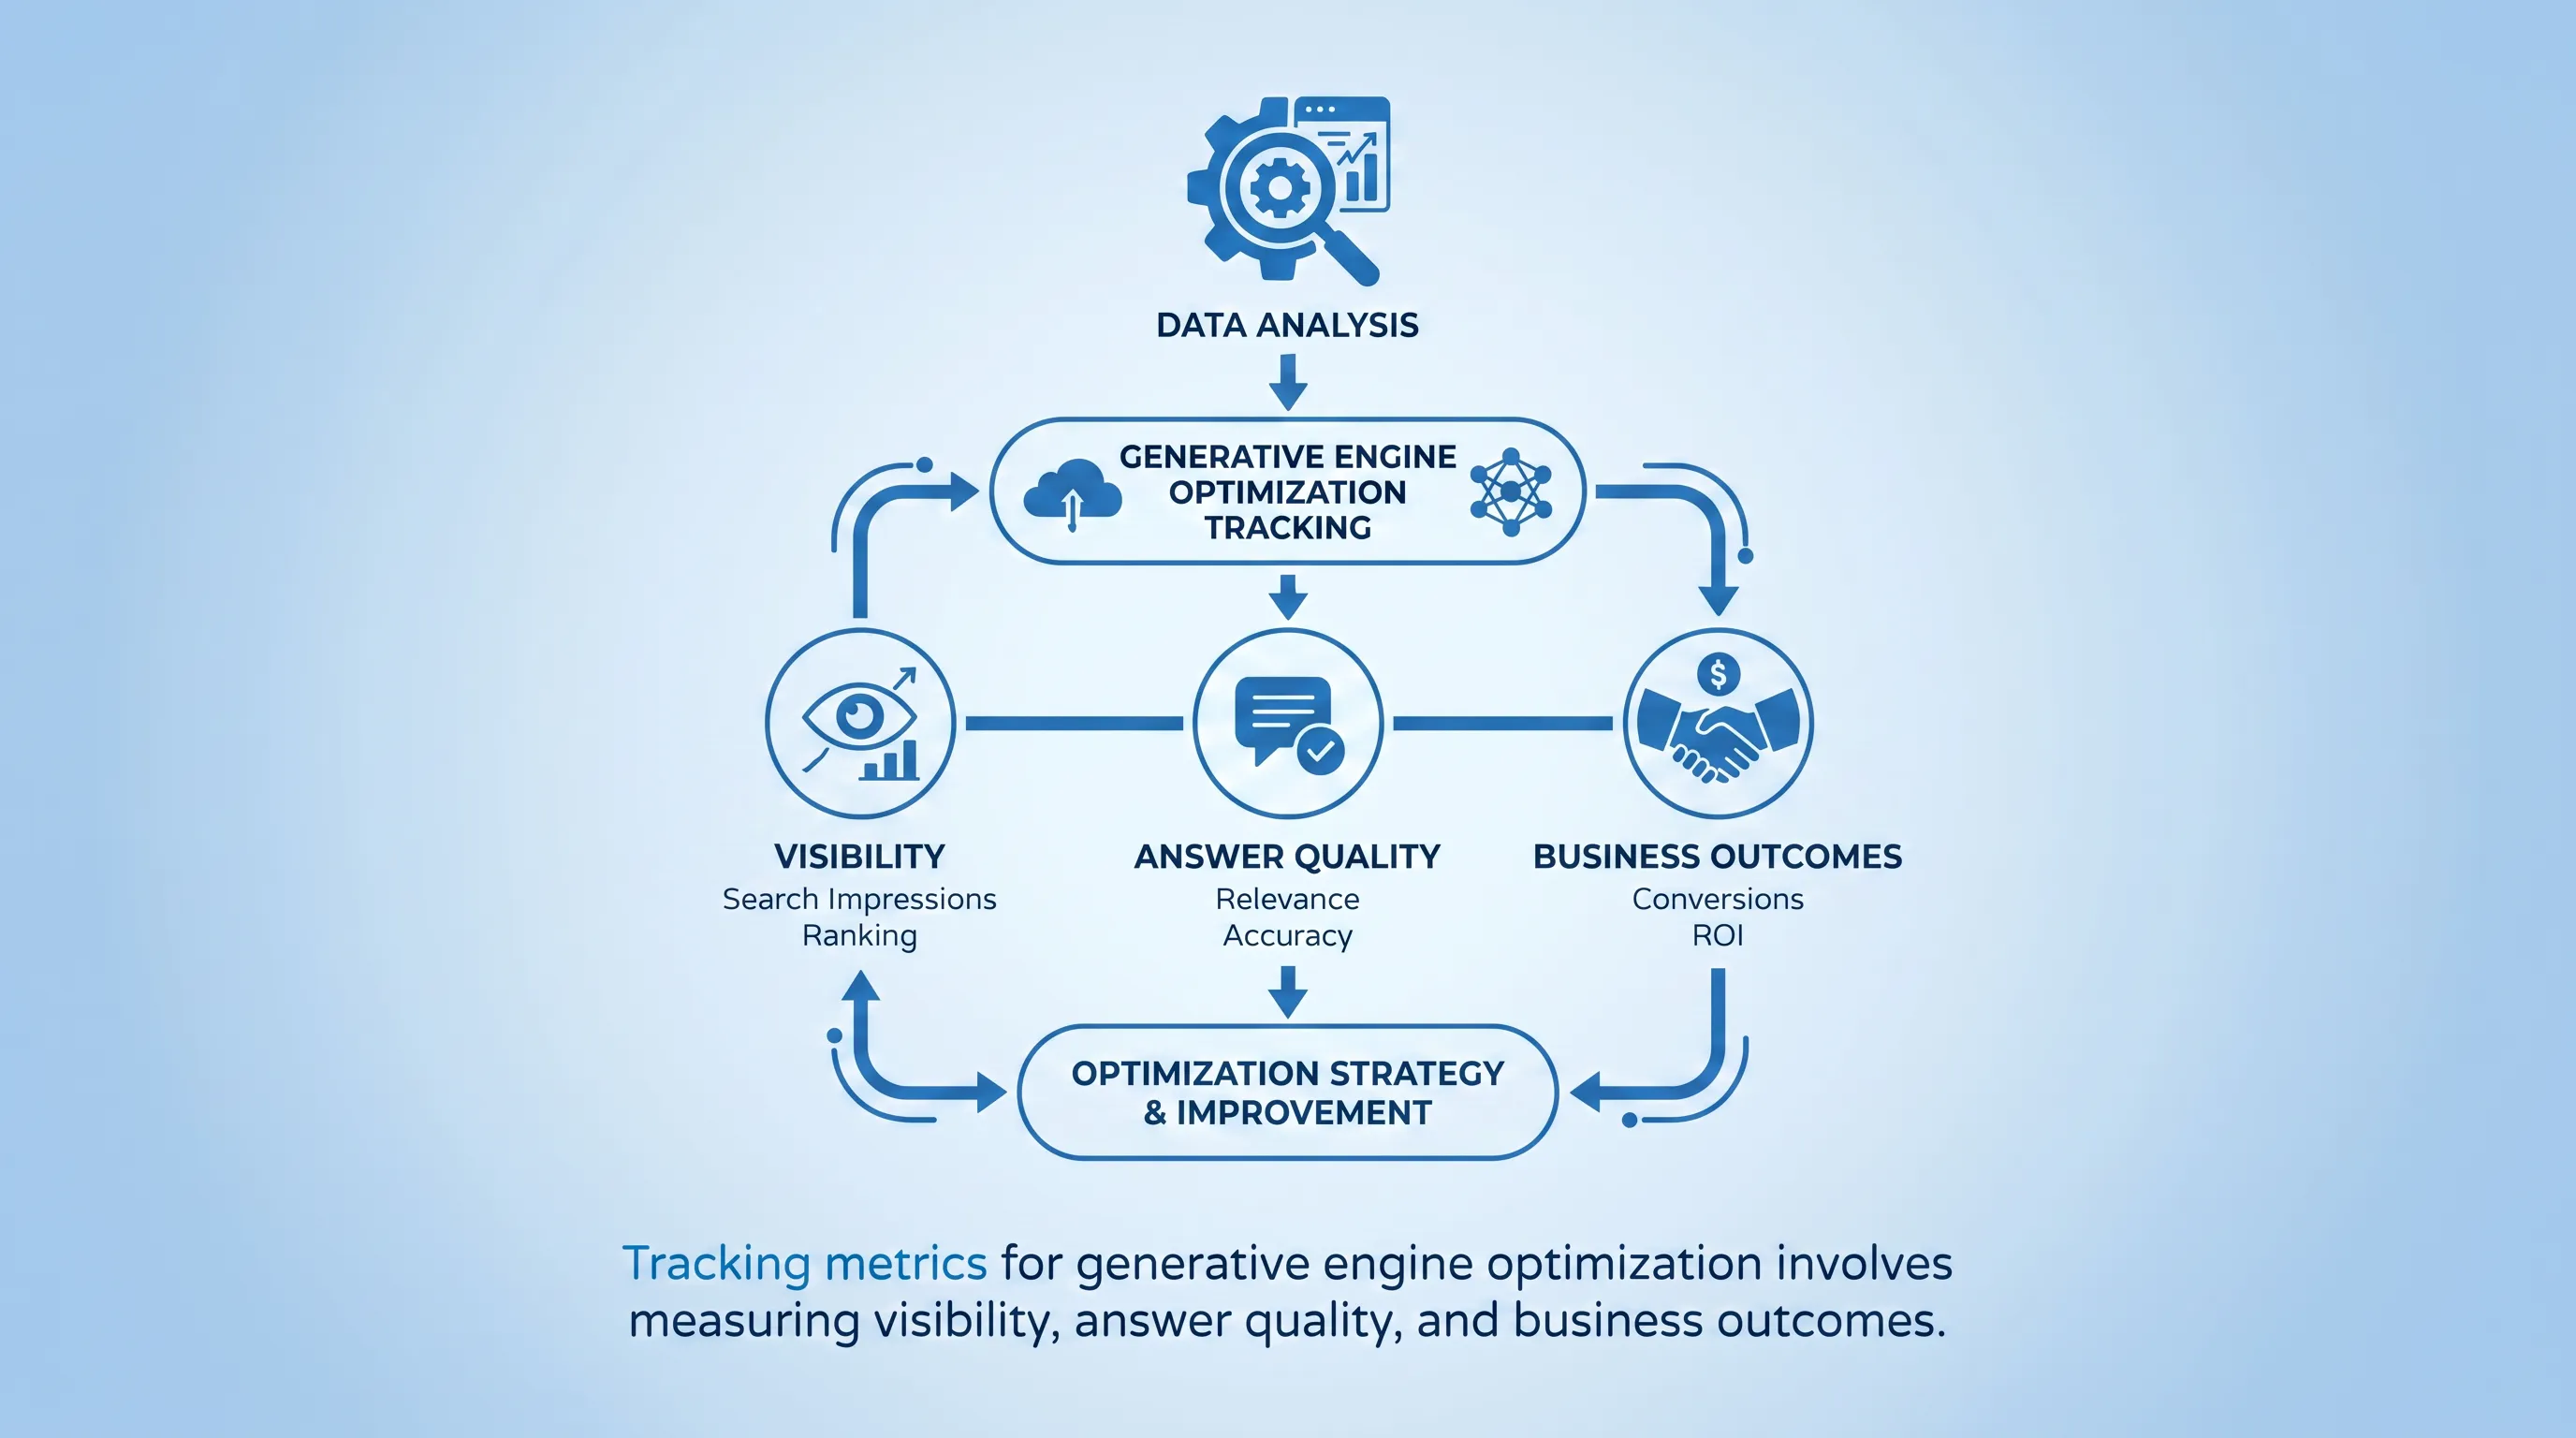
A flat, vector-based flowchart illustrating data processes with soft blue and white gradients, maintaining a minimalistic and modern aesthetic.

Define each measure in one sentence and name the action it triggers as part of how to measure generative engine optimization. That last part is the test. A metric that doesn't change anyone's behavior is decoration.

Report the families separately. Visibility tells you whether the model reaches for you. Answer quality tells you whether being reached for helps or hurts. Business outcomes tell you whether any of it pays. Combining them into one headline number produces the false comfort we started this piece rejecting, and it makes diagnosis impossible when a number moves.

Visibility GEO metrics

Mention rate is the share of tracked answers that name your brand, calculated as answers containing the brand divided by total answers generated across the prompt set. Citation rate is narrower: the share of answers that link to a page on your domain. The two diverge more than teams expect, because models name brands they don't link and link pages they don't name.

Answer prominence records where you appear. First mention in the answer body carries different weight from a footnote in a source list. Share of voice is your mentions divided by all brand mentions across the same prompts, which only means something if you name your comparison set in advance and keep it fixed. Ahrefs analyzed 863,000 keywords and 4 million AI Overview URLs and found 38% of cited pages also ranked in the organic top 10, down from 76% in its July study, so rankings alone won't predict your citation rate.

Segment every one of these geo metrics by platform and prompt group. A 40% mention rate that comes entirely from branded prompts is a different business situation from 40% spread across comparison queries. Averaging them hides the gap you most need to close.

Answer quality metrics

Being mentioned isn't the same as being described correctly. The Tow Center for Digital Journalism tested eight AI search tools on 200 news excerpts and reported that chatbots gave incorrect answers to more than 60% of queries, with fabricated links and confident phrasing. If a model can misattribute a published article, it can misstate your pricing tiers.

Four judgments belong in a human review rubric, scored on a simple three-point scale by one reviewer with a second checking a sample:

  1. Factual accuracy: are the claims about your product and pricing correct?

  2. Message consistency: does the description match your positioning, or an outdated version of it?

  3. Sentiment: is the framing favorable or dismissive relative to competitors in the same answer?

  4. Citation support: does the linked source actually contain the claim attributed to it?

Automated sentiment scoring handles volume but misses the cases that matter, like a technically positive sentence that positions you as the budget option. Review a sample of 20 to 30 answers per cycle by hand. That's enough to catch systematic misstatement without turning generative search measurement into a full-time job.

Business outcome metrics

Track AI referral sessions as their own channel. In Google Analytics 4, a custom channel group matching openai.com and perplexity.ai separates them out. Then measure engagement and pipeline against that segment.

The volume will look small and the quality will look excellent. Semrush's analysis put AI search visitors at 4.4x the conversion rate of traditional organic visitors, and Adobe, which drew on more than a trillion visits to US retail sites, reported AI-referred traffic converting 54% better than non-AI sources in May 2026, a reversal from the year before.

Referral traffic still understates the contribution in generative search measurement, because most AI answers never produce a click. SparkToro and Similarweb measured 68.01% of US Google searches ending without a click in early 2026, up from 60.45% in 2024. Someone who reads your product described accurately in an answer and later searches your brand name directly shows up nowhere in your referral report. Watch branded search volume and self-reported attribution on forms to catch that influence.

Need help with your AI visibility?

Book a free consultation with our experts we'll help you determine exactly which services your organization needs.

Establish useful benchmarks

Run your full prompt set across your chosen platforms before the campaign begins and store the raw answers as the baseline of how to measure generative engine optimization. That pre-campaign baseline is the only defensible comparison you'll have, because industry averages won't match your category or your competitive set.

Name your competitors explicitly: three to five brands your sales team hears about in deals. Measure them with the same prompts in the same sessions. A drop in your mention rate while every tracked competitor also drops points at a platform change.

Separate your work from market-wide shifts by logging platform events alongside your data. Google made Gemini 3 the default model behind AI Overviews in January 2026, and SE Ranking's analysis after that upgrade found it replaced roughly 42% of the domains previously cited. Without that note in your log, a sharp swing in your GEO metrics looks like something you did.

Control prompt variability

Because outputs are probabilistic, one run of a prompt tells you almost nothing, and how to measure generative engine optimization has to account for that. Run each prompt at least five times per platform per cycle, in fresh sessions, and record every response. Report the average and the range together, since a 60% mention rate that swings between 20% and 100% is a different reality from one that sits steadily near 60%.

Retain the raw answers as text. When a metric moves, the raw text is what tells you why, and it's what lets a second reviewer check a judgment you made three months ago. Storage is cheap and re-running history is impossible.

Keep the testing window tight, ideally one or two days, so a mid-run model update doesn't split your sample. Watch for prompt drift too: rewording a prompt for clarity breaks its comparability, so treat any edit as a new prompt with a new start date. Act when a change holds across two consecutive cycles and sits outside the range you recorded at baseline. Anything smaller than that is the system breathing.

Build the GEO dashboard

Structure reporting in four blocks that mirror the metric families of generative search measurement, with visibility and answer quality set beside competitive position and business outcomes. Executives read the top layer, which shows trends over months. Beneath it, keep prompt-level diagnostics so anyone can click from "share of voice fell" to the eight specific prompts where you lost ground.

Add Google's generative AI performance report to the visibility block if your property has access. Google confirmed the reports show impressions within AI Overviews and AI Mode as a dedicated view, though click data isn't included yet, which is worth stating on the dashboard so nobody reads impressions as traffic.

Set two rhythms. Weekly monitoring catches breakage, like a competitor suddenly dominating a comparison prompt or a factual error spreading across platforms. Monthly or quarterly reviews are where budget and roadmap decisions get made, because that's the timescale on which generative search measurement produces signal.

Improve from the findings

Every weak metric in your geo metrics points to a specific fix. Low citation rate with healthy rankings means your pages aren't extractable, so tighten the structure and add clear claim-and-source blocks. Low mention rate on unbranded comparison prompts is an authority problem that third-party coverage and review sites solve better than your blog does. The KDD 2024 paper that coined the term found tactics like citing sources and adding statistics lifted visibility by up to 40% in generative responses.

Match the other failures the same way. Factual errors in answers call for updated, crawlable canonical pages stating the correct information plainly. Weak sentiment against a named competitor calls for messaging work and better comparison content. Thin AI referral conversion calls for landing pages that match what the answer promised.

  • Poor citation rate: improve page structure and fix crawl access for AI user agents.

  • Poor mention rate on category prompts: invest in third-party authority and independent coverage.

  • Accuracy or sentiment problems: publish corrected canonical facts and refresh outdated comparison pages.

The teams that get this right treat how to measure generative engine optimization as the input to content decisions. Snoika builds AI visibility programs and helps teams set up defensible measurement across ChatGPT and AI Overviews. If you need a program that holds up under scrutiny, book a call with Snoika Foundation for expert GEO guidance.

Conclusion

Knowing how to measure generative engine optimization comes down to discipline: a fixed prompt set and honest baselines. Volatility is a property of these systems, so measure it instead of smoothing it away. Report visibility and answer quality side by side. Then act only when a change survives two cycles, because that's how you learn how to measure generative engine optimization in a way your leadership will trust.
Need help with your AI visibility?

Book a free consultation with our experts we'll help you determine exactly which services your organization needs.

Review the rotating prompts quarterly, but keep the 30 to 50 core prompts unchanged for a full reporting period. Add a new prompt when sales calls, site searches, or customer interviews reveal a recurring question. If you rewrite a core prompt, record it as a new prompt rather than replacing its history.

Save the full response text, prompt text, platform, model version, country, language, account state, date, and session number. This record lets reviewers verify mentions, citations, and factual claims after a metric changes. A screenshot can supplement the text when an interface shows placement that plain text doesn't preserve.

You can compare countries only when each country has its own fixed prompt set and controlled language settings. Treat each market as a separate report because local results, cited sources, and product availability affect answers. Don't combine country-level rates into one figure unless the prompt mix and sample size match.

Unanswered prompts show where a platform doesn't produce a useful recommendation or source list for your topic. Record them separately from answers that omit your brand, because the two cases require different interpretation. A rise in unanswered prompts can also indicate a platform change, which belongs in your event log.

Snoika Foundation can apply the framework by fixing a core prompt set, recording baseline responses, and reviewing results on a regular schedule. To learn how to measure generative engine optimization, keep visibility, answer quality, and referral outcomes in separate dashboard sections. Investigate changes only after they persist across two cycles.

Book a Demo

Book a time that works best for you

You Might Also Like

Discover more insights and articles

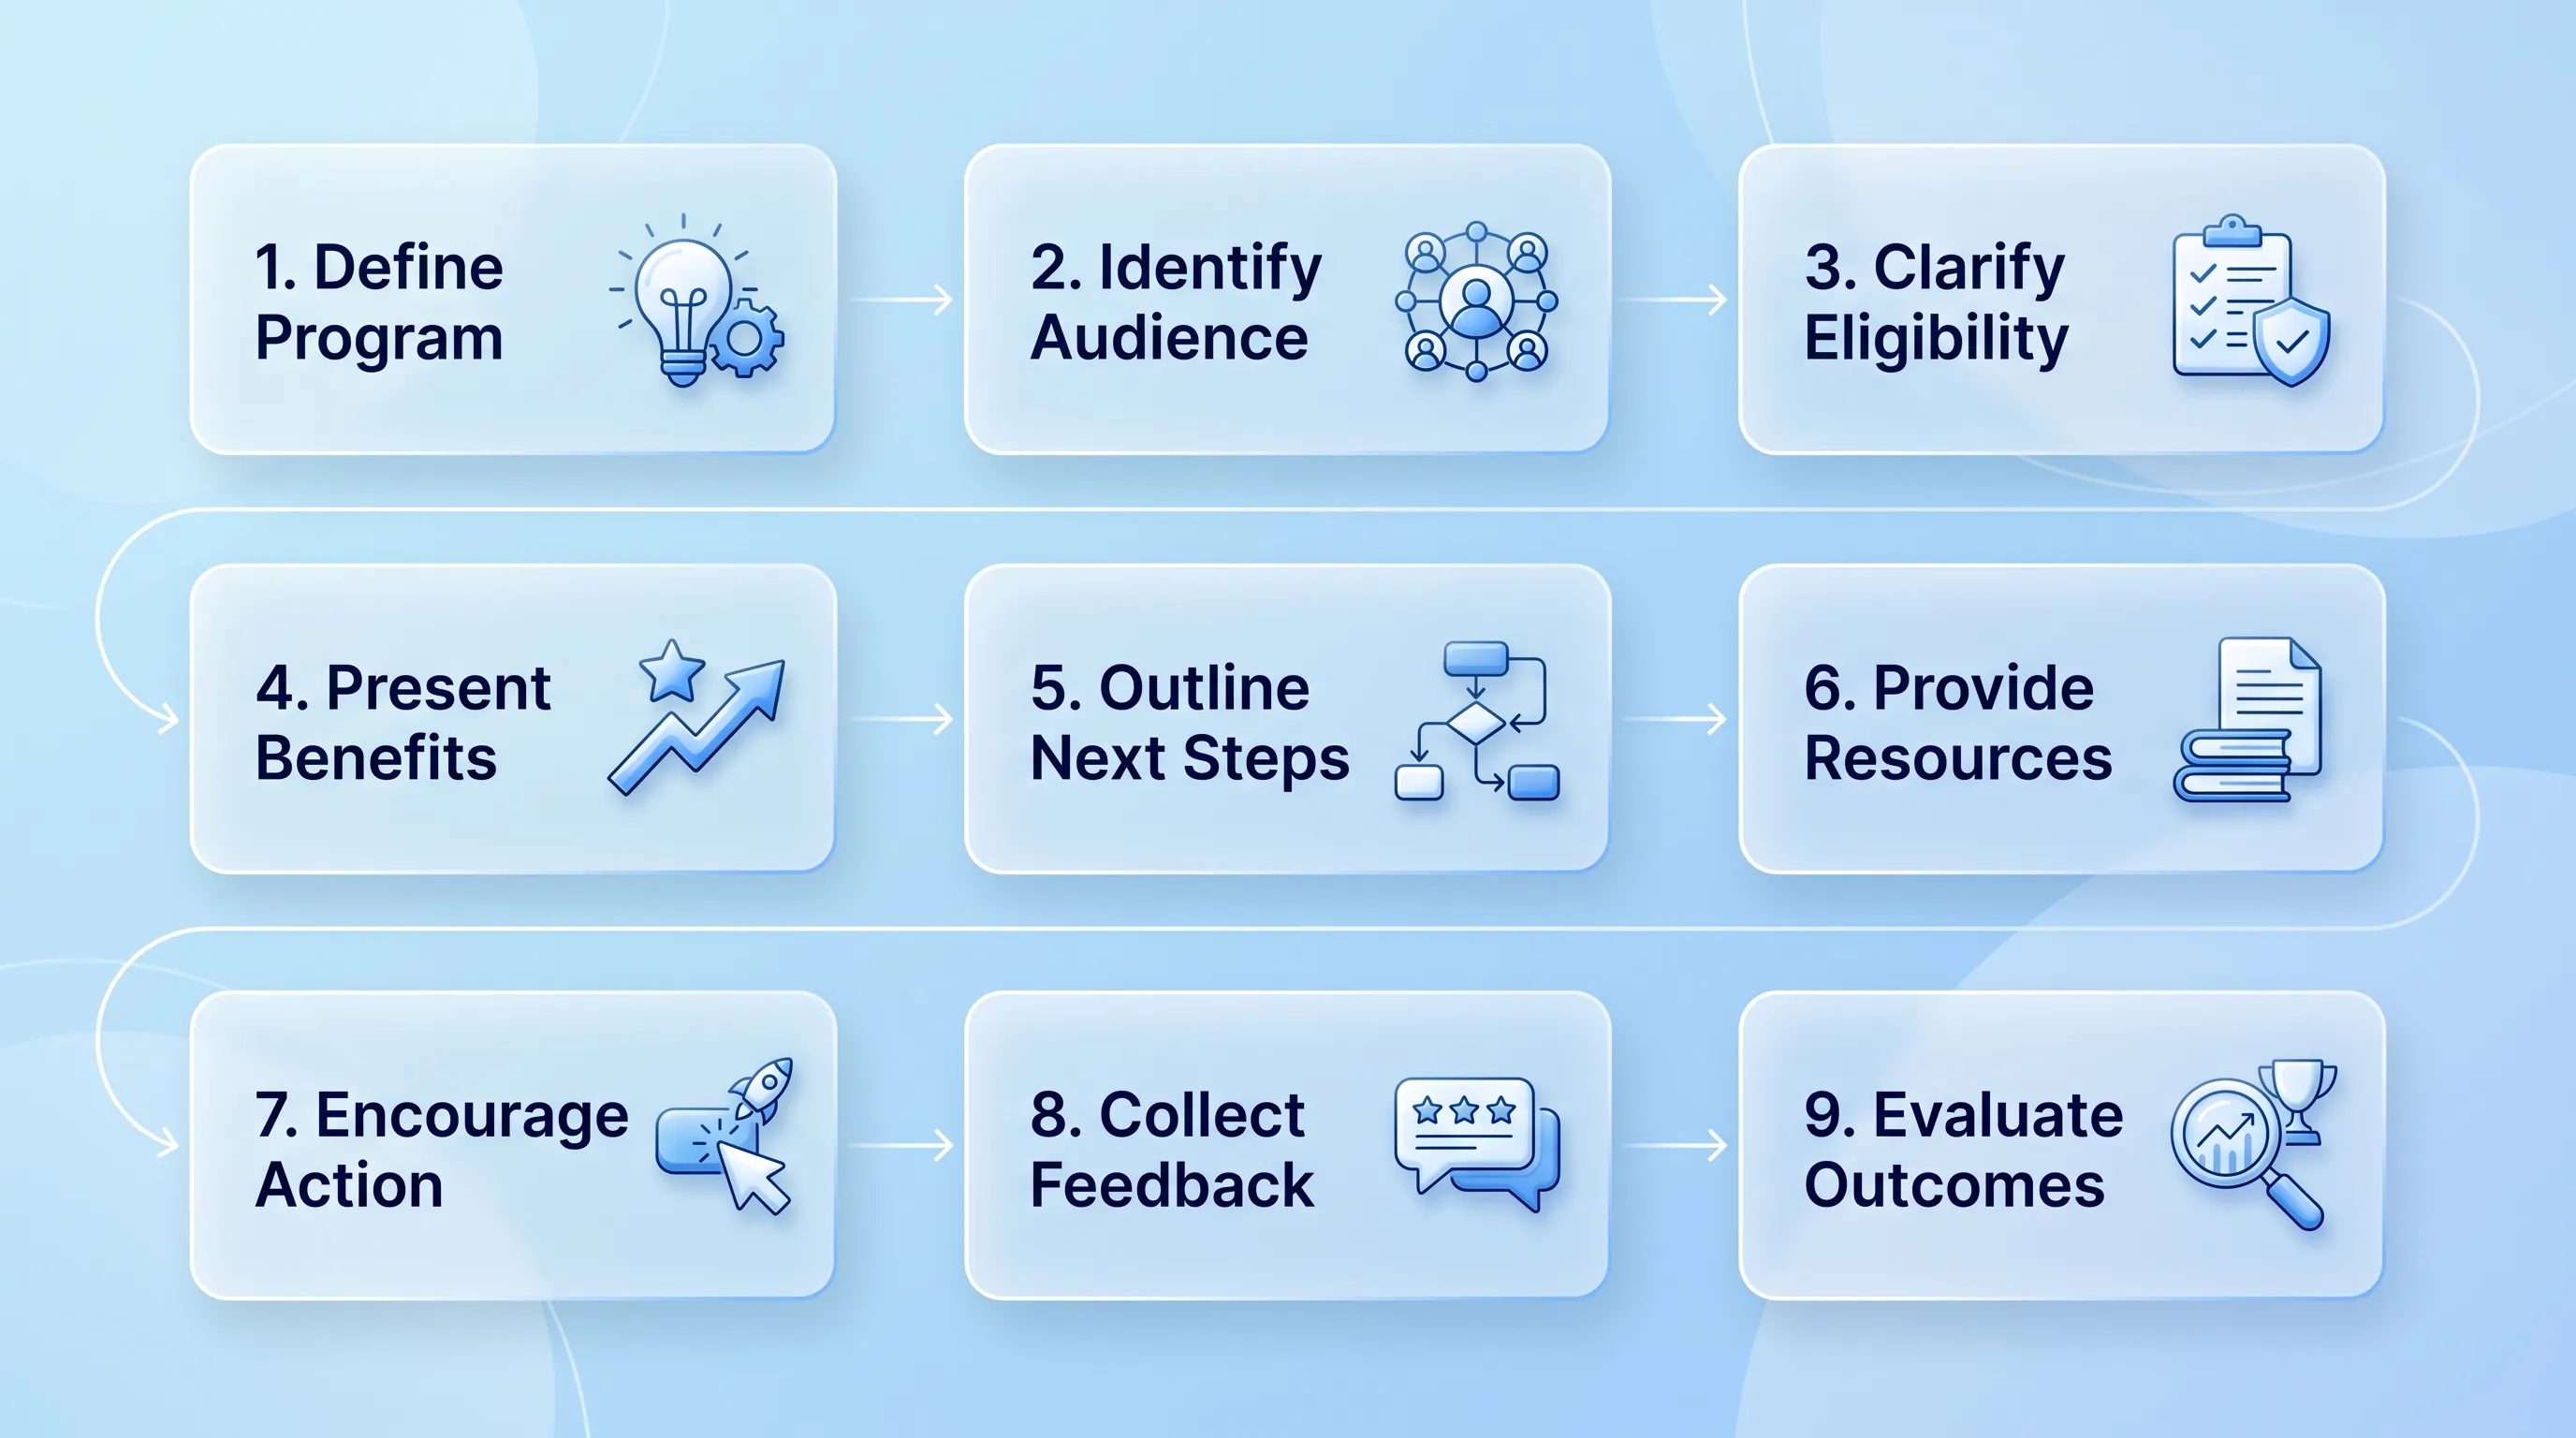
Infographic with a glassmorphism style, featuring a 9-step process in three rows, with elegant blue-and-white icons and flowing connections.

How to Build AI-Ready Program Pages That Convert

This article explains how to rebuild a programme page as an AI-ready program page structure so that a prospective participant and a language model can work out in seconds what you do and whether it applies to them. It walks through a nine-block architecture and a publishing workflow you can run with a small team.

Modern infographic with soft blue gradient background, featuring four circular glassmorphism cards connected by subtle lines and icons.

Nonprofit Call to Action Examples for Donations, Volunteers, and Advocacy

This article is a working swipe file of nonprofit call to action examples you can adapt for donations and volunteer recruitment. It covers copy formulas and a simple testing method so you can replace vague asks with ones that actually get completed.

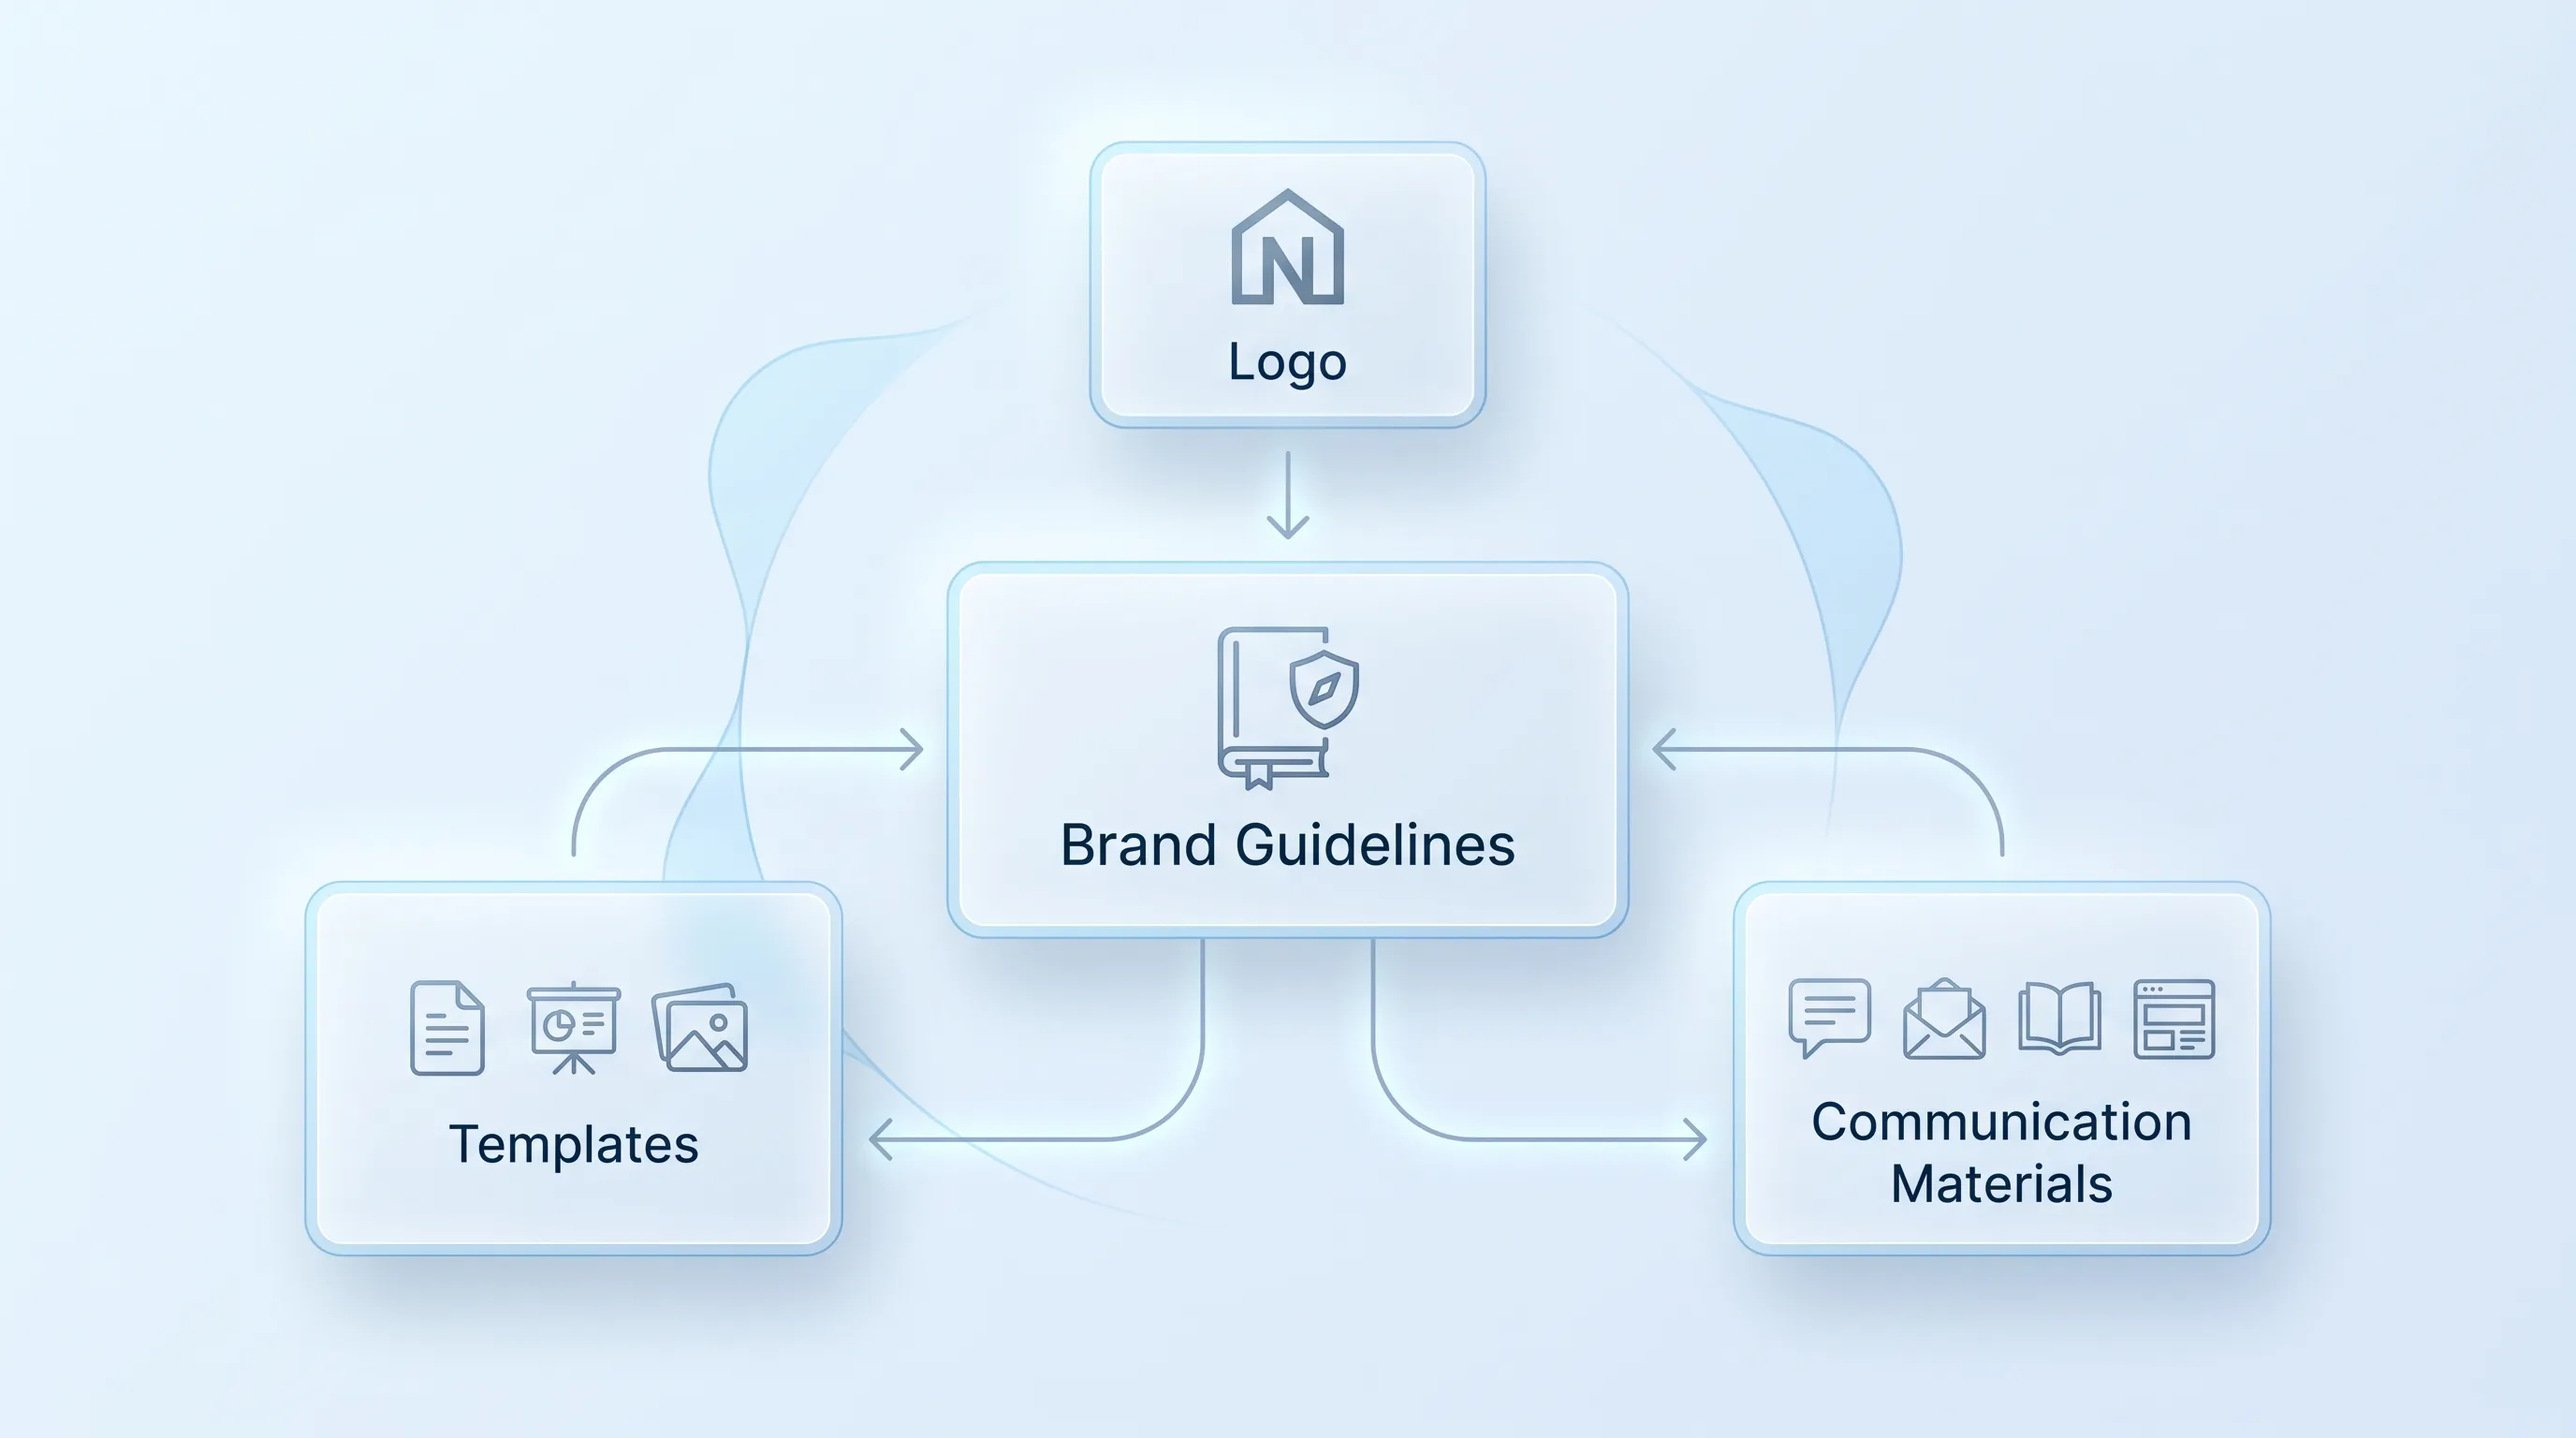
Modern B2B technology infographic with frosted-glass cards, soft blue gradient, and elegant connections, centered on "Brand Guidelines.

Nonprofit Brand Identity: How to Build a Consistent System Beyond the Logo

This article explains how to build a nonprofit brand identity that survives contact with reality: twelve staff members and no in-house design team. It covers the visual and verbal systems behind that consistency, plus the templates and governance that keep the whole thing alive after launch.

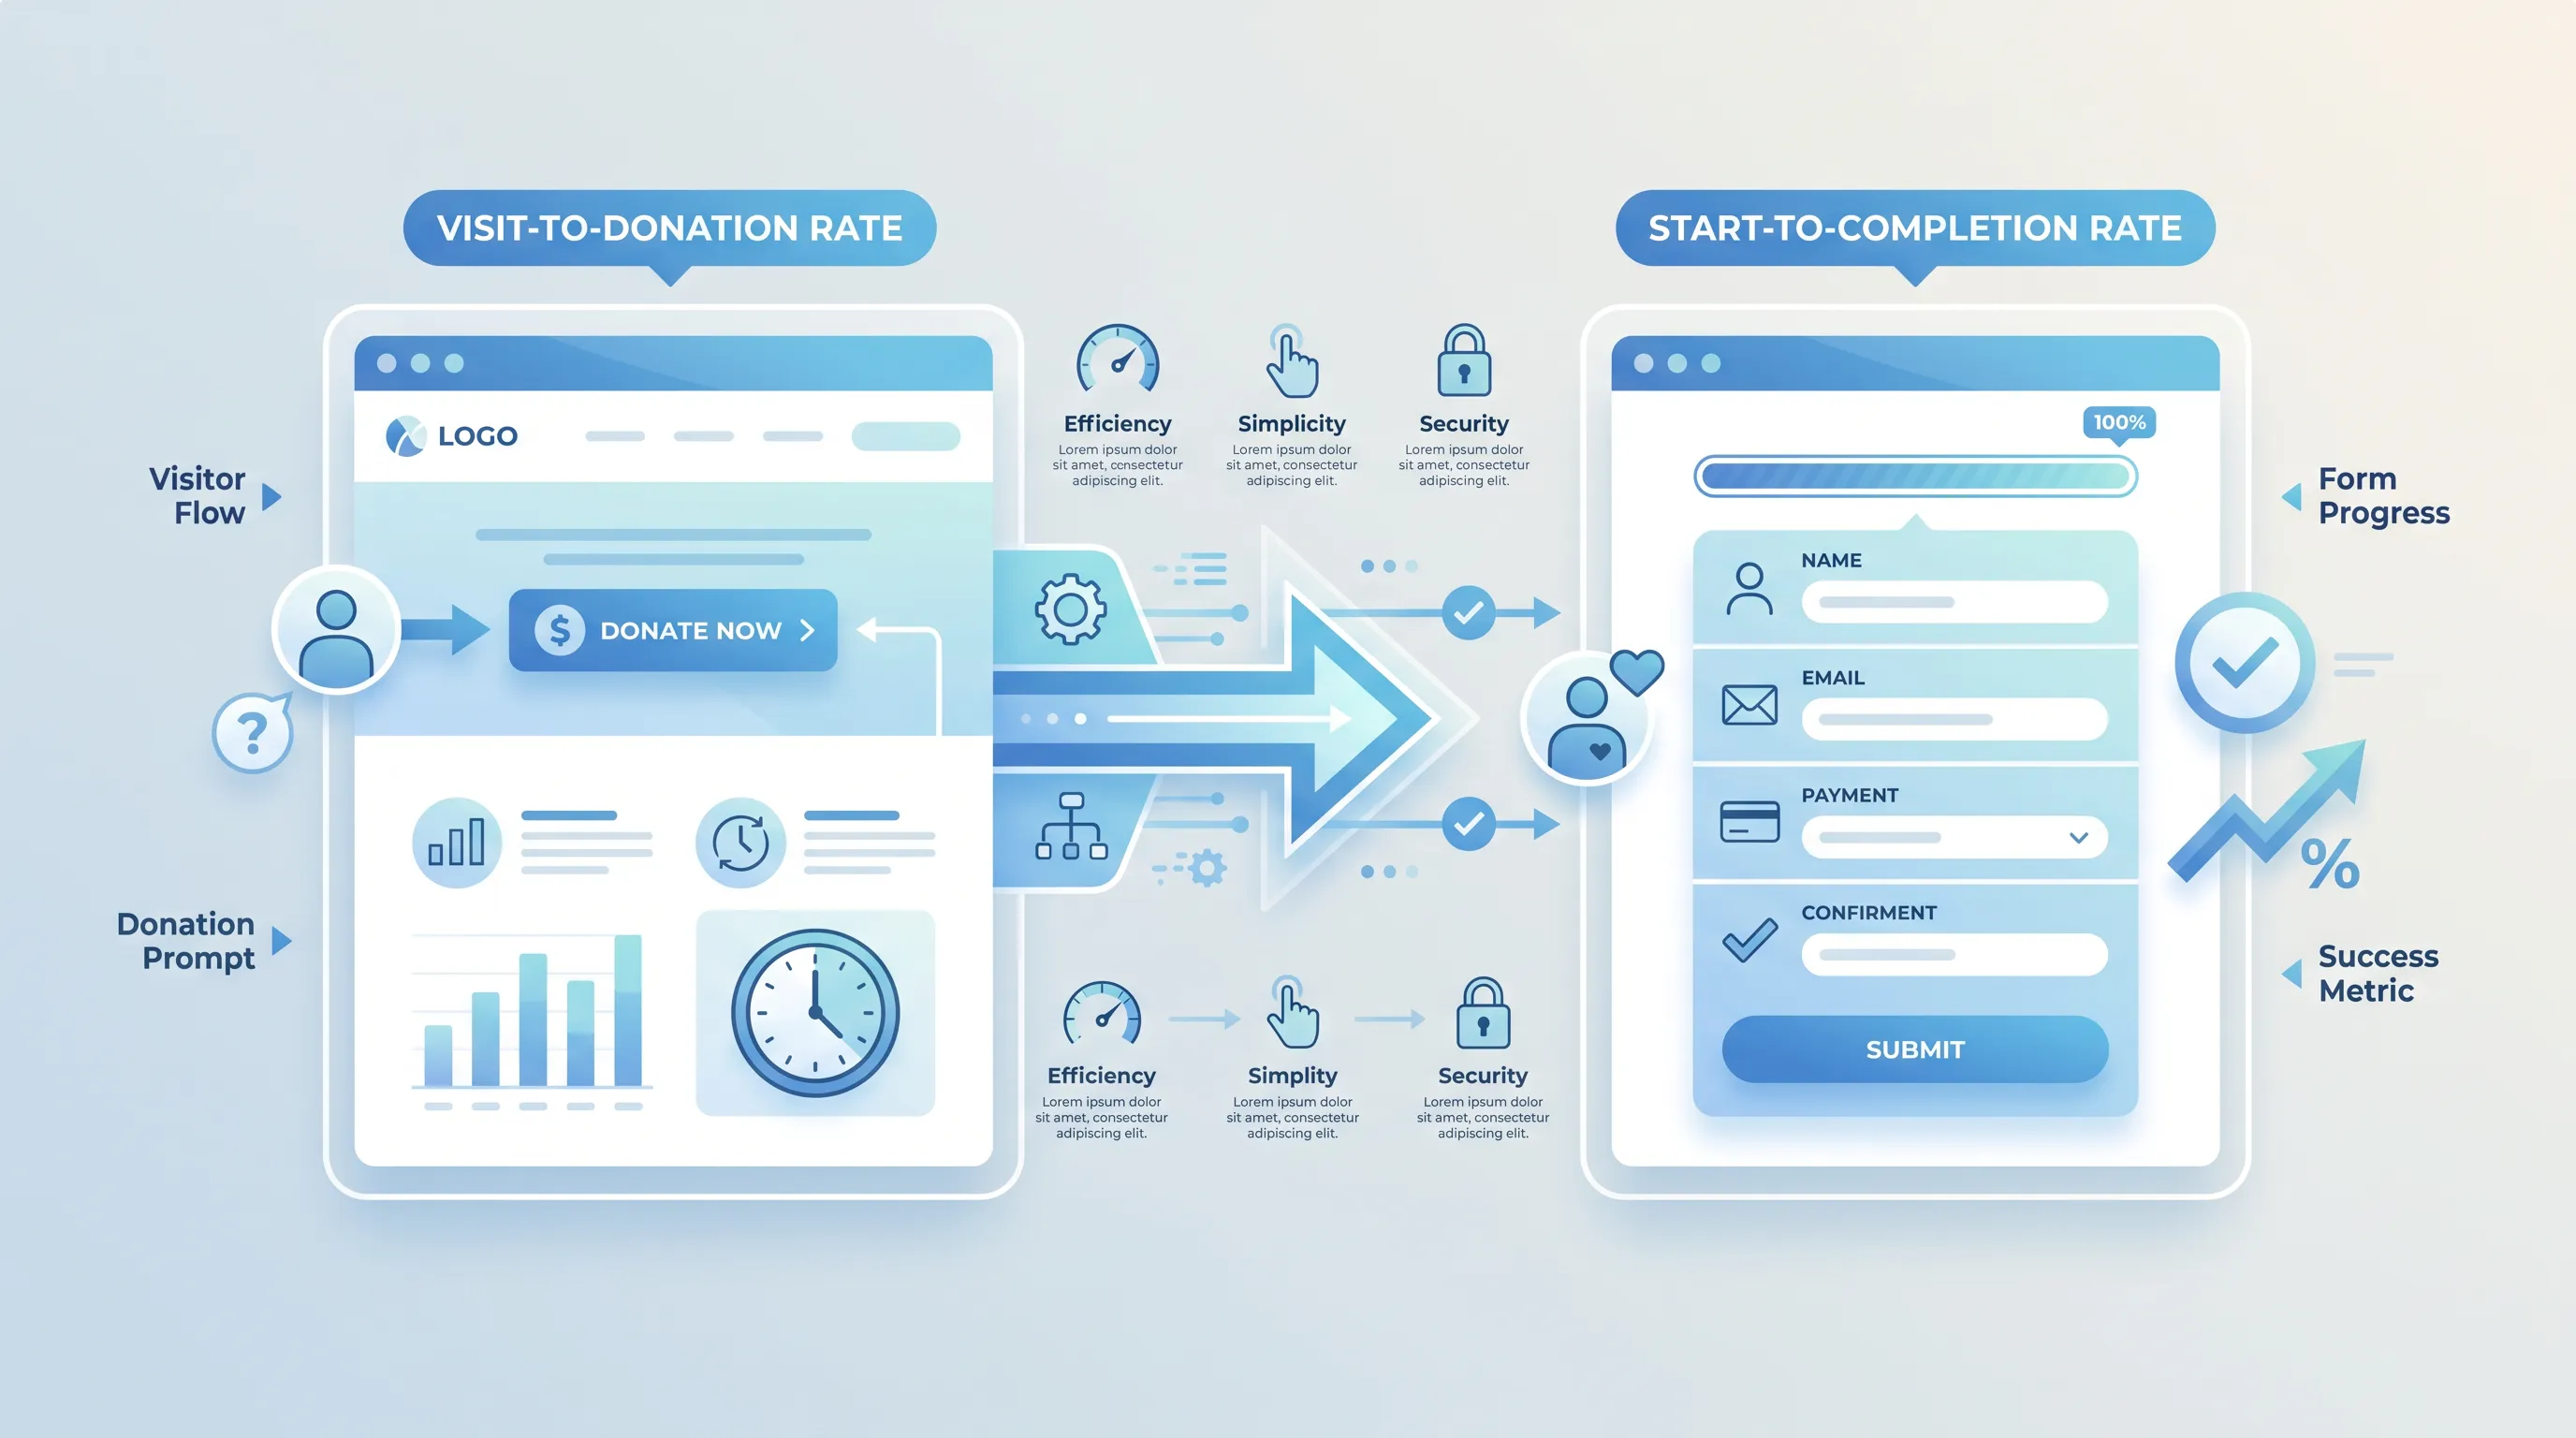
Flat design infographic comparing two donation website types: 'Visit-to-Donation Rate' on the left and 'Start-to-Completion Rate' on the right, with arrows i…

Donation Page Conversion Rate: Formula, Benchmarks, and Diagnostics

This article explains how to calculate and benchmark a donation page conversion rate without mixing up denominators. It walks through two formulas with worked numbers and a repeatable diagnostic sequence you can run before you change anything on the page.