From Raw Reports to AI-Discoverable Impact Content

Content authorArtem LozinskyPublished onReading time11 min read
Abstract analytics chart in a soft blue gradient background, surrounded by thin blue line icons and arrows, conveying a technology theme.

This article explains how to turn completed evaluation reports into web resources that people and machines can actually read and cite. It covers prioritisation and safeguarding boundaries. It also covers a step-by-step publishing workflow and what to measure afterwards.

Why PDF evidence disappears

Most of the evidence your organisation produces already exists. It sits in a 94-page PDF on a page nobody links to, and impact report optimization starts with admitting that publishing a file is not the same as publishing knowledge. The report was signed off. The findings were sound. And then nothing happened.

The accessibility problem is documented. In WebAIM's 2026 screen reader survey, 85.6% of respondents said PDFs are likely to pose accessibility issues, up from 75.1% in 2019. The UK Government Analysis Function puts the discovery problem plainly: search engines cannot look inside document formats, which makes the content harder to find. Google has said since 2011 that images are not indexed inside PDF files, so every chart in your evaluation is invisible to a crawler.

Neil Williams, former Head of GOV.UK, summed it up in a 2018 Government Digital Service post: "Compared with HTML content, information published in a PDF is harder to find, use and maintain." That part is settled. What is not settled is how large language models treat your material. Figures circulate claiming precise AI citation rates for PDF versus HTML, and when you chase them to source they turn out to be about something else entirely. Treat content to AI transformation as a way to improve your odds in impact report optimization.

Prioritise your report library

You don't have the capacity to convert everything, and you shouldn't try. Only 44% of UK charities described themselves as advancing or advanced in their use of digital in the 2025 Charity Digital Skills Report. The figure fell to 32% among small charities. A library-wide conversion project designed for a team that doesn't exist will stall by week three.

Rank what you have against six questions before anyone opens a document:

  • Evidence value: does the report contain findings that hold up on their own, or is it a narrative progress update?

  • Audience demand: are partners or funders already asking for this material?

  • Current relevance: is the programme live, and does the geography still match where you work?

  • Publication rights: who owns it, and what did the contract say about reuse?

  • Sensitivity: how much of it concerns identifiable participants or contested locations?

  • Conversion effort: is there a source file, or only a flattened scan?

Pick three to five reports that score well on the first two and badly on neither of the last two. That's your pilot. An evidence-backed publication system built on five strong resources teaches your team more than fifty rushed ones, and it gives you something to show a funder when you ask for the budget to continue with impact report optimization.

Set responsible boundaries

Before anything is extracted, decide the boundary in writing. Some material is publishable as it stands. Some can be published as aggregate figures with no site-level detail. Some needs redaction. Some needs a delay until a programme closes, and some should never leave your server.

The humanitarian sector has already worked through this. The Centre for Humanitarian Data's guidance on re-identification from microdata shows how removing names and phone numbers is not enough, because combining variables such as location and ethnicity can still expose individuals. OCHA's data responsibility guidelines, first agreed in October 2021 and updated in January 2025, include a sensitivity classification model you can adapt rather than invent.

Consent is the question most teams skip. If participants agreed to be interviewed for an internal evaluation, they did not agree to have their quotes indexed and summarised by a chatbot. Where the research involves Indigenous or local knowledge, the CARE Principles published in 2019 by the Global Indigenous Data Alliance set out Authority to Control as a requirement, not a courtesy, and they apply to data you collected years ago as much as to new work. Donor restrictions and embargoes on unpublished evidence belong in the same register. Content to AI transformation without this step is just a faster route to a safeguarding incident during impact report optimization.

Need help with your AI visibility?

Book a free consultation with our experts we'll help you determine exactly which services your organization needs.

Impact report optimization workflow

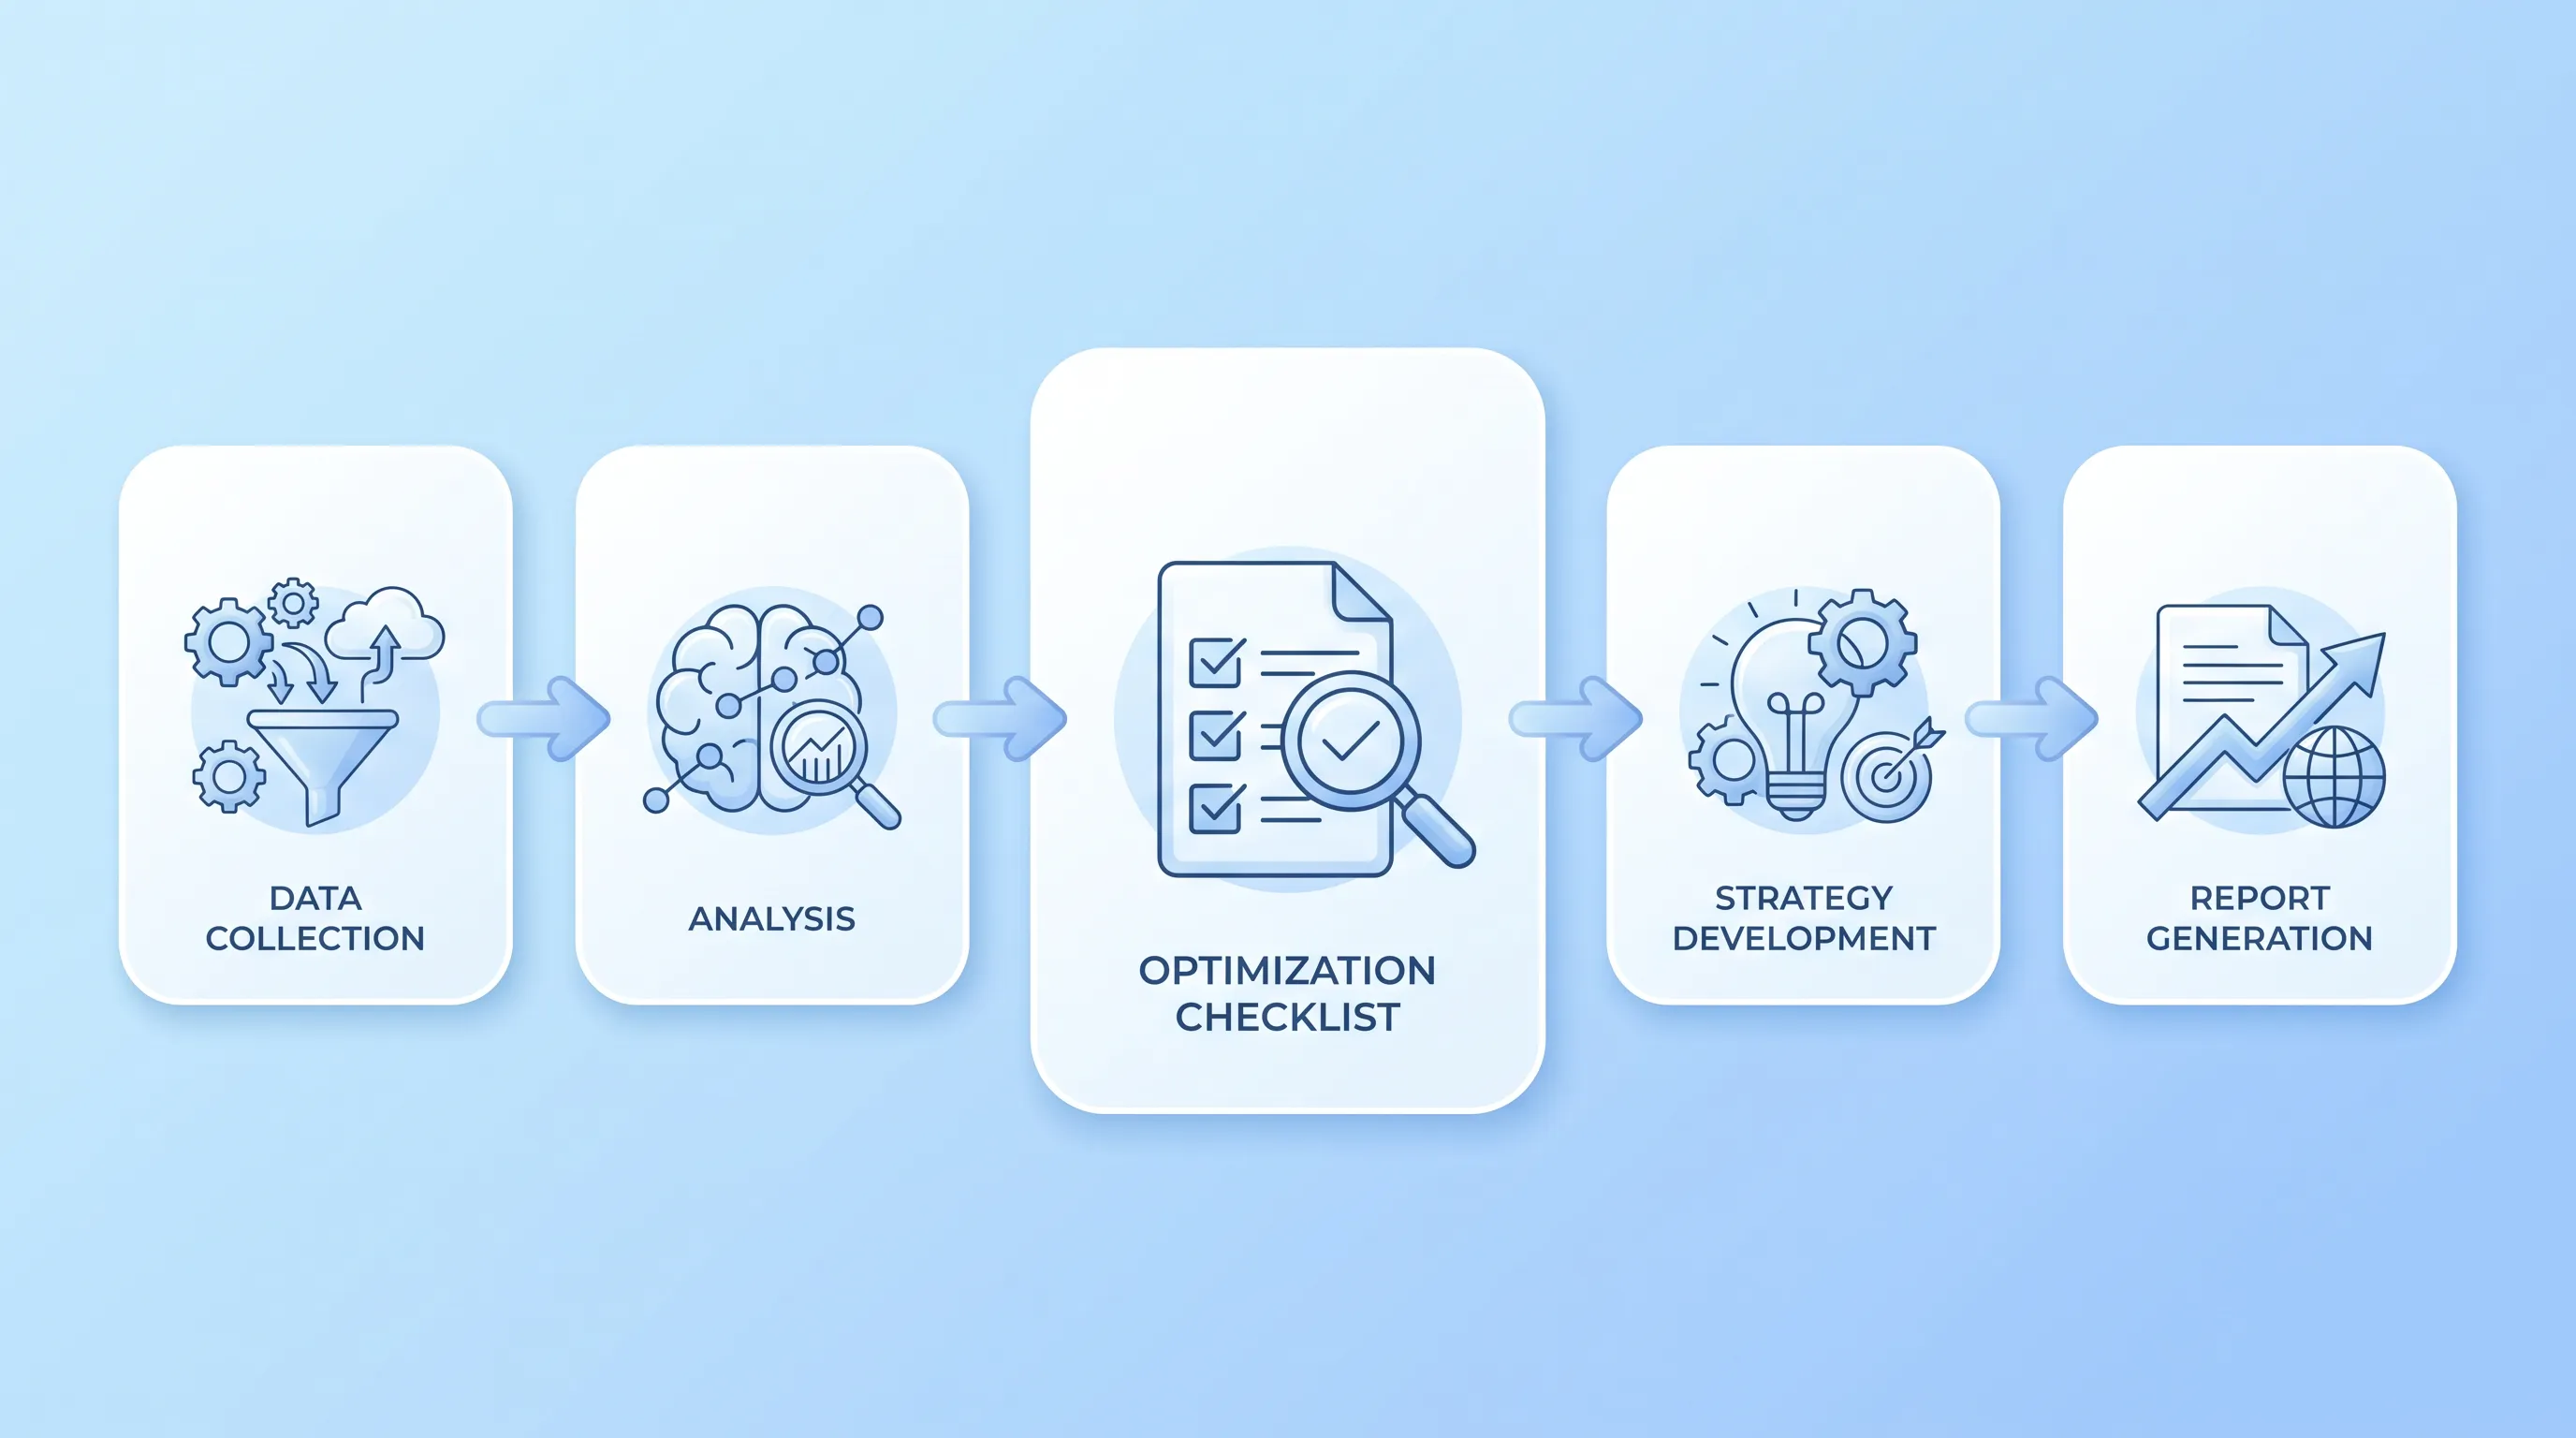
Conceptual icons in soft blue shades illustrating stages of an impact report optimization workflow, with a central checklist and connecting arrows.

What follows fits inside your existing reporting cycle. The moment a report is signed off is the moment to run impact report optimization, because every person who knows the methodology is still available and still remembers it. Six months later they've moved programmes.

Responsibilities should be fixed before you start. The monitoring, evaluation and learning (MEL) lead owns accuracy of findings. Programme staff own context and current status. Communications owns clarity and safeguarding owns the risk call. Whoever manages your website owns the technical build. Legal reviews licensing and donor terms once per batch rather than once per page.

Audit the source

Confirm you hold publication rights and that the version in your hands is the final one. Check the methodology section and the geographic scope. Check the fieldwork dates and the limitations the evaluator wrote down. Note any citations to third-party material you'd be reproducing.

Then read it as a risk document. Where are the participant quotes and the village names? Where are the photographs and the annexes with raw tables? Flag the accessibility barriers too, because a scanned report with no text layer needs optical character recognition (OCR) before anything else happens.

Extract reusable findings

Pull out the findings the evaluator stood behind and the evidence underneath them. Include the recommendations that followed. Definitions matter more than they look: if the report defines "household" or "retained in programme" in a particular way, that definition travels with the number or the number becomes meaningless.

Preserve the hedging. If the evaluator wrote that attendance was associated with improved outcomes, your web page says associated. If a finding rests on 40 interviews in two districts, the page says so in the same sentence as the finding. The temptation to round a qualified result into a headline is the single fastest way to lose the trust of the people most likely to cite you.

Content to AI transformation

Now convert. A concise summary of 150 to 250 words at the top in plain language that answers what was studied and what was found. Accessible HTML for the full extract, with real headings and tables marked up as tables. Charts rebuilt as downloadable data files so the numbers exist outside the image. Machine-readable metadata using schema.org Dataset markup where you're publishing figures, which is what Google Dataset Search reads.

Be honest with your board about what this buys you. Google Dataset Search is a crawler-driven index with no submission form and no approval queue, and the Dataset type currently appears on 10K to 100K domains according to Google's web index aggregation. Structure makes your evidence retrievable. Whether a model quotes it is outside your control, and anyone who promises otherwise is selling something. Content to AI transformation for impact report optimization improves the conditions for citation and stops there.

Need help with your AI visibility?

Book a free consultation with our experts we'll help you determine exactly which services your organization needs.

Review and publish

Four sign-offs run in order. The subject expert confirms the findings are represented correctly, and safeguarding confirms the boundary from earlier in this workflow has held. An editor confirms a non-specialist can follow it, and the web team confirms the markup validates. Nothing publishes with three of four.

Every page carries a canonical link to the source report and the version date. A named contact and the licence sit on the same page. CC BY 4.0 requires anyone reusing your material to credit you and link the licence. It also requires them to flag changes, which is what an NGO wants. Publish your corrections procedure in the same place, because impact report optimization with a visible route to flag an error reads as evidence.

Build an evidence-backed publication system

A template turns one-off work into an evidence-backed publication system. Use the same field order on every resource page so that a partner comparing two of your evaluations, or a model parsing both, encounters an identical structure. Consistency does more for machine readability than any single piece of markup.

Each page should carry the programme name and location. Record the population studied and the methods used. State the headline findings with their stated limitations. Include the fieldwork and publication dates. Name the funder and the evaluator. Add a link to the source report and a suggested citation. Write the citation out in full so nobody has to guess how to credit you.

Then connect it. Every resource page links to the programme page it belongs to and to the thematic page that groups related evidence, and both of those link back. An evidence-backed publication system for impact report optimization with orphaned pages is a filing cabinet with a web address.

Avoid common publishing mistakes

These are the failures that show up repeatedly once a team gets moving:

  1. Unlabelled extracts, where a figure sits on a page with no indication of which report or which year it came from.

  2. Missing provenance, so the reader can see the finding but cannot reach the evaluation behind it.

  3. Inaccessible charts published as images with no alternative text. Low contrast text already affected 83.9% of home pages in the 2026 WebAIM Million, so the baseline is poor before you add anything.

  4. Inconsistent metadata across pages, which breaks the comparability your template was built to create.

  5. Broken links to the original PDF after a site migration.

  6. Duplicate pages competing with each other for the same finding.

  7. Sensitive detail surviving in an annex nobody reread.

  8. Claims the evaluator never made, introduced during the summary write-up.

  9. Datasets published with no documentation and no reuse terms, which leaves users unable to interpret the columns and unsure whether they're allowed to.

The NHS digital service manual advises teams to avoid all non-HTML documents where people will read on screen, and GOV.UK notes you are required to make documents accessible under the Equality Act 2010. Impact report optimization that reproduces an inaccessible PDF as an inaccessible web page has solved nothing.

Maintain and measure value

Assign a named owner to each resource page for link checks and metadata quality. That owner also handles corrections and retention decisions. Set a review date at publication. A system nobody maintains decays quietly, and the first sign is a funder emailing to say the download is dead.

Measure a spread of things rather than one. Organic discovery and downloads tell you about reach. Formal citations in academic work and partner proposals tell you about credibility. Internal reuse matters as much: if your own proposal writers now pull from the resource pages instead of hunting through SharePoint, the evidence-backed publication system is paying for itself. Track partner enquiries and any programme decision that referenced a published finding.

Resist making AI mentions the headline metric. Pew Research Center found that Google users clicked a traditional result on 8% of visits where an AI summary appeared, compared with 15% without one, which means visibility inside AI answers and traffic to your site are now partly in tension. Among charities surveyed in 2026, 79% reported using AI tools in daily work, so your peers are already in this environment. Content to AI transformation is one channel inside a wider impact report optimization effort, and judging the whole effort by chatbot mentions misreads what the work is for. Use visibility tracking as one measure among several.

Start with one pilot

Choose one report. Assess its risk. Extract the findings that survive that assessment and build the accessible formats. Run the four reviews and publish with full provenance. Connect it to your programme pages and measure what happens over a quarter. Then do the next one.

Snoika Foundation works with NGOs and public institutions on exactly this: making credible evidence findable and citable in both Google and AI assistants. If you want help scoping a pilot or reviewing where your current library stands, book a call with our team and we'll walk through impact report optimization for your own reports.
Need help with your AI visibility?

Book a free consultation with our experts we'll help you determine exactly which services your organization needs.

You need written permission when the funder or evaluator controls copyright or reuse rights. Check the contract for publication, quotation, image, and data terms, then record the approval with the report version. Ask permission before publishing participant quotes, photographs, extracts, or downloadable datasets.

Mark the page as superseded and explain what changed. Keep the original version available when retention rules allow it, but link clearly to the newer evaluation and add its publication date. This preserves the historical record while preventing readers from treating an old result as current evidence.

Compare the OCR text against every page of the original scan before publication. Pay closest attention to decimal points, negative signs, table headings, names, and footnotes because a small transcription error can change the meaning. Ask the subject expert to approve corrected text and record the source page.

No, structured data cannot guarantee citation by an AI system. It gives crawlers consistent information about the dataset, source, and publisher, but each system chooses what it retrieves and displays. Treat citation visibility as one measure within impact report optimization, alongside downloads, referrals, and evidence reuse.

Snoika Foundation can help an organisation review its report library, select a suitable pilot, and map the publication workflow to its evidence and safeguarding needs. A booked call can be used to discuss the reports, constraints, and review process before deciding whether outside support is appropriate.

Book a Demo

Book a time that works best for you

You Might Also Like

Discover more insights and articles

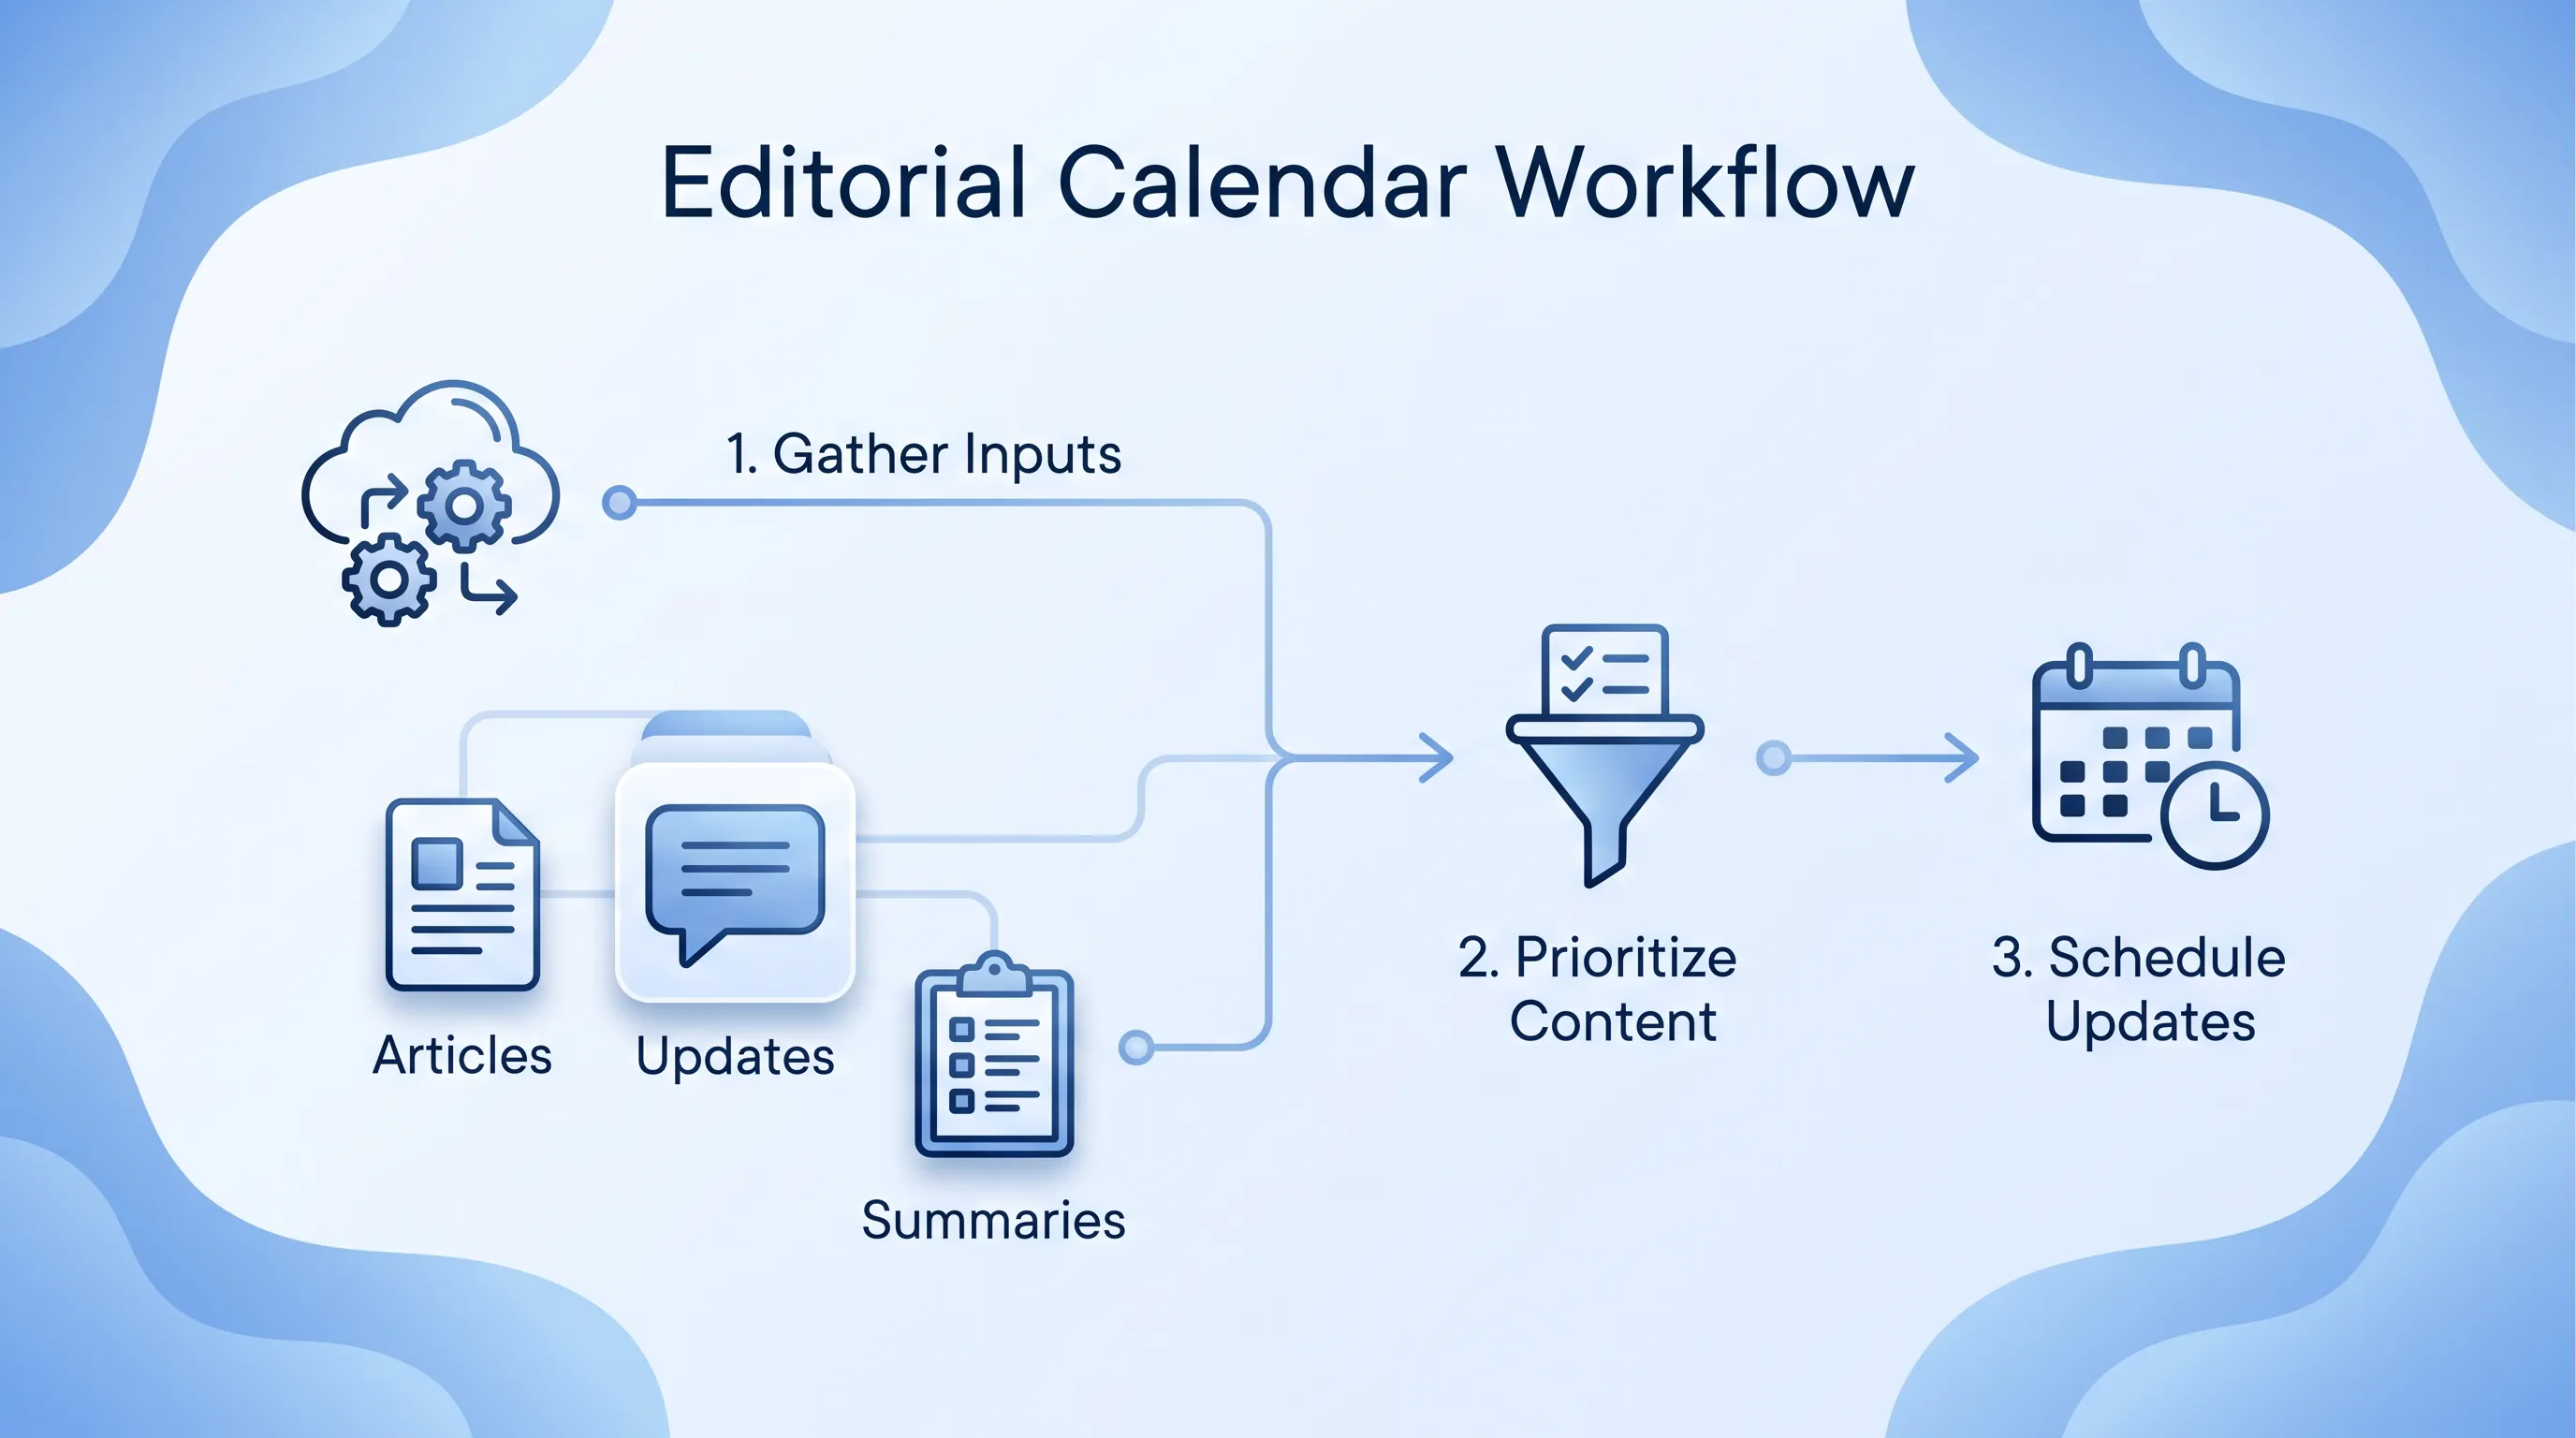
A diagram of an editorial calendar workflow in blue shades, featuring interconnected icons and labeled steps in a modern, clean style.

AI-Powered Editorial Calendar for Continuous Visibility

This article explains how a small communications team can plan publishing and maintenance in one spreadsheet that follows documented reader demand instead of the awareness-day treadmill. It covers inputs and prioritisation. A worked four-week example and the review questions worth asking at month end follow.

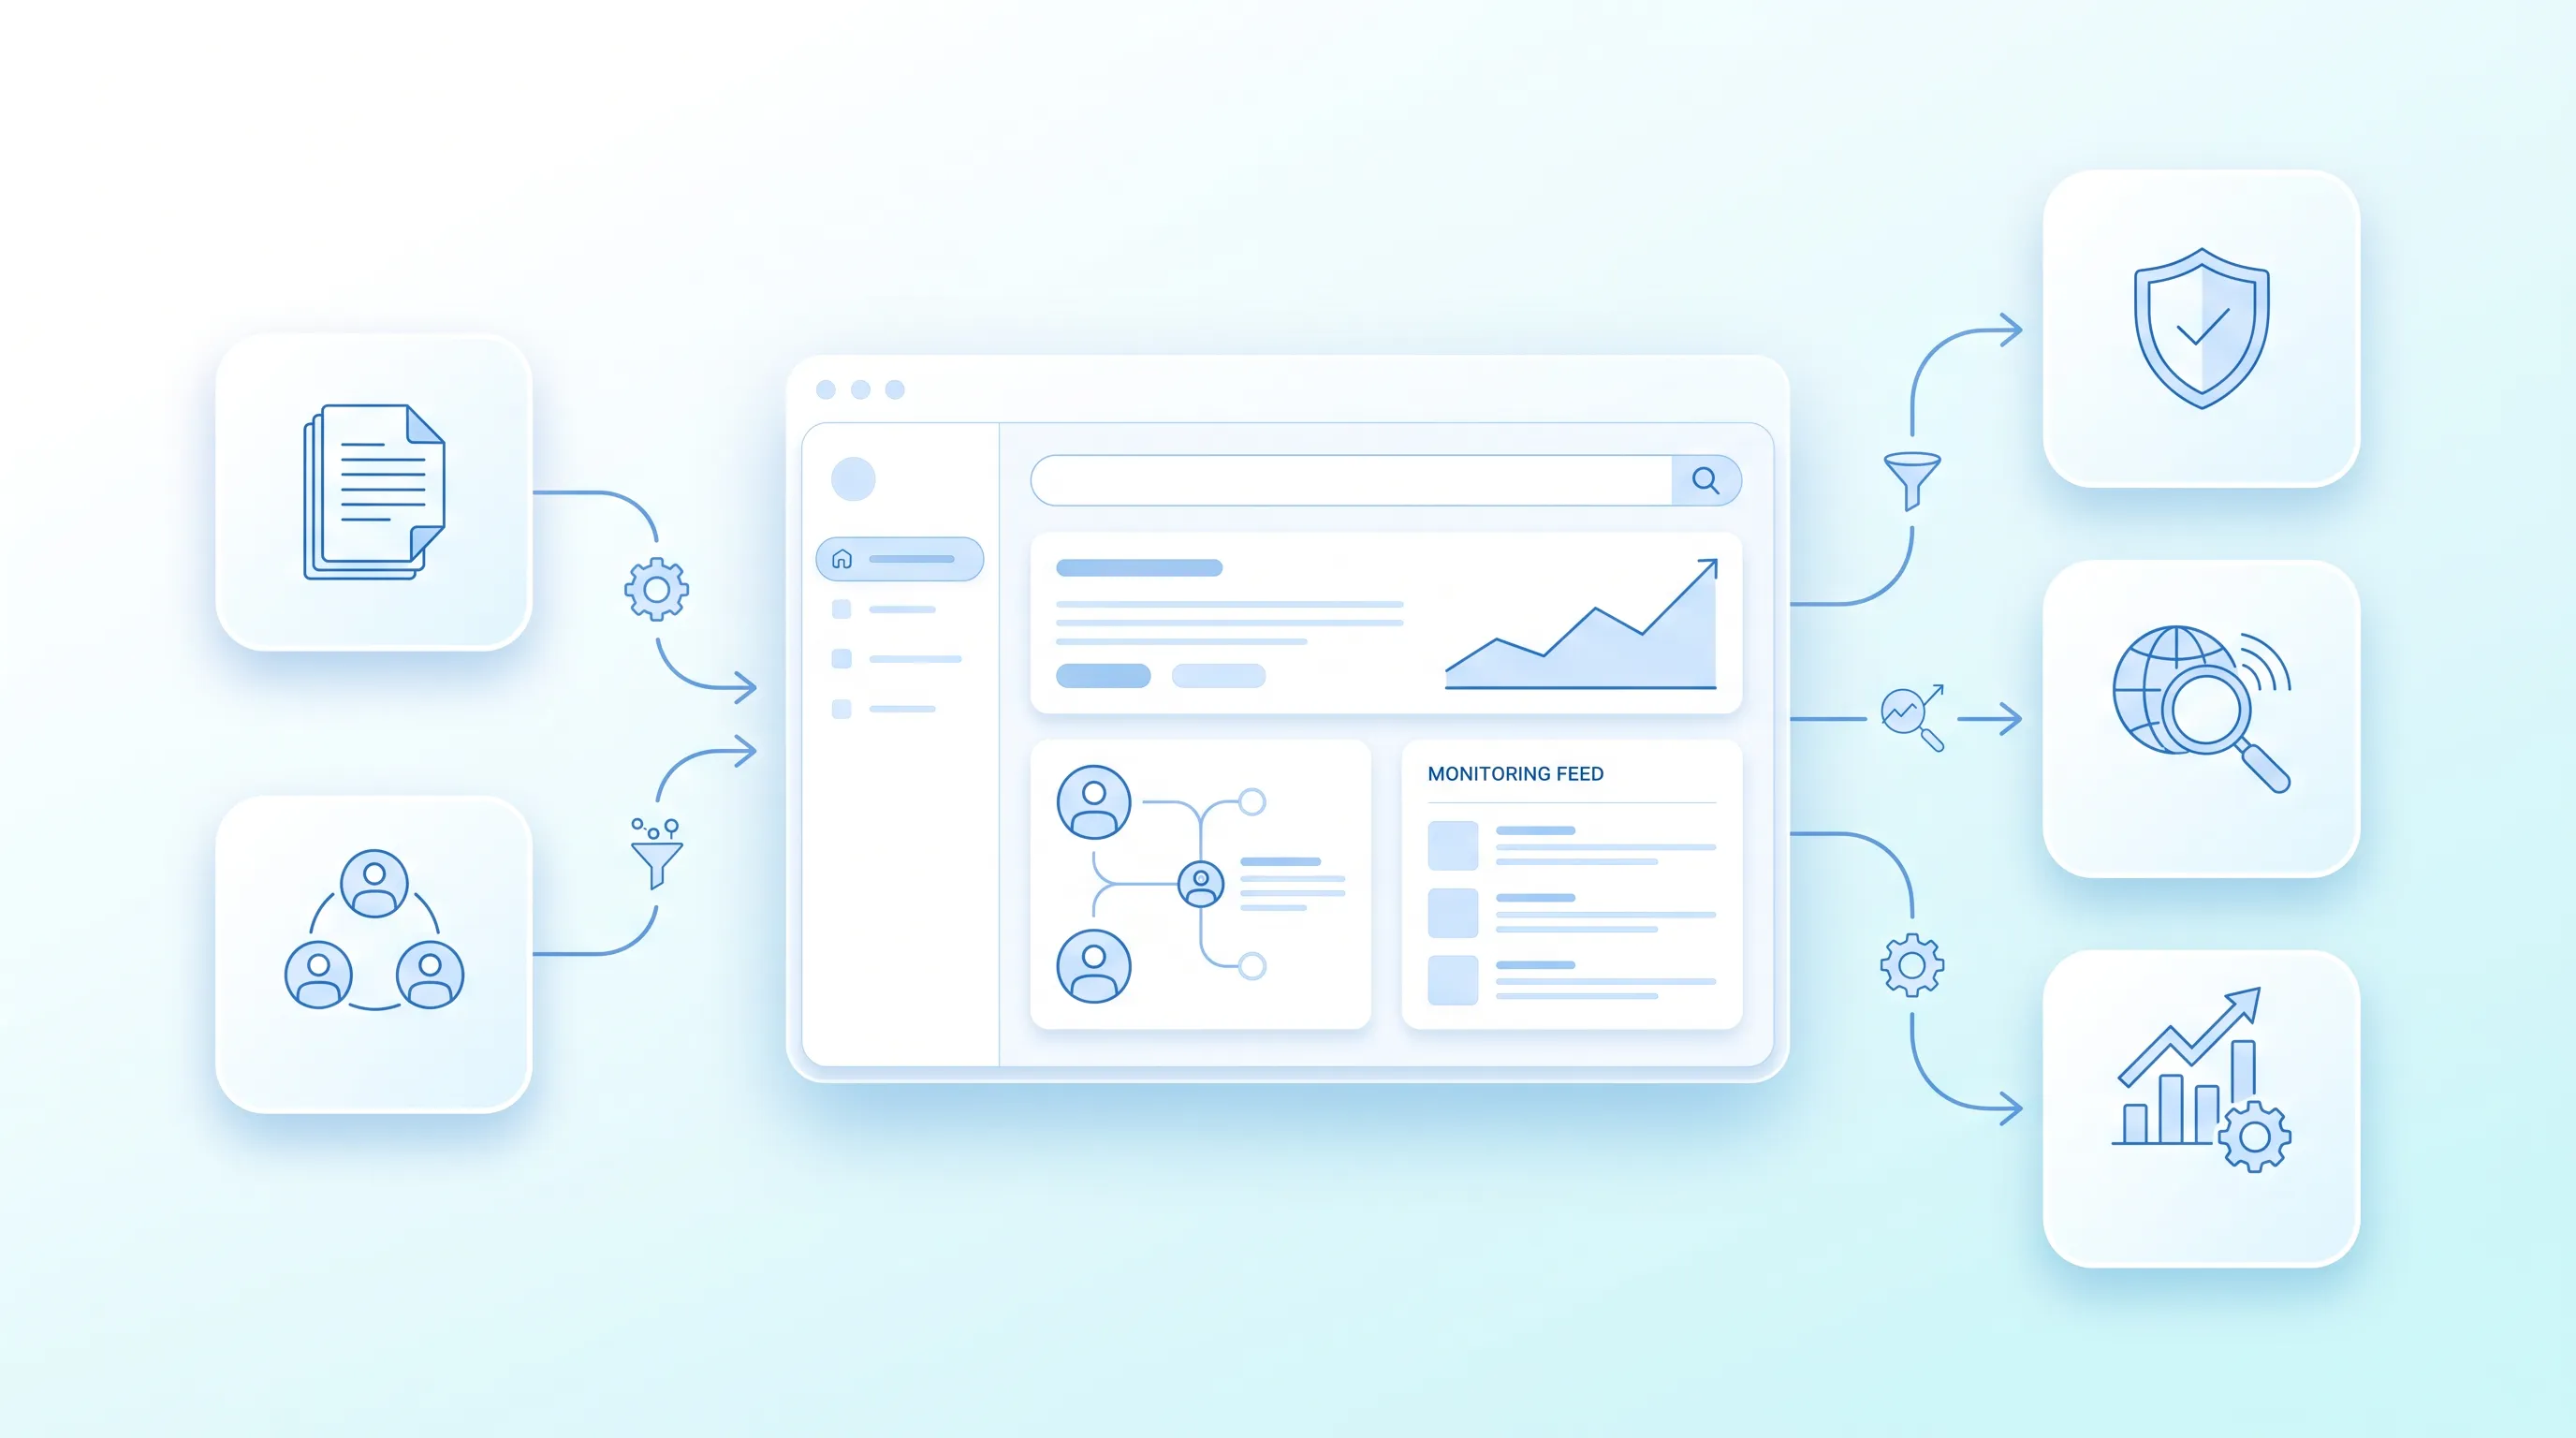
Modern infographic illustrating a central browser interface for nonprofit competitive intelligence, surrounded by symbolic blue icons and connectors.

Competitive Visibility Monitoring for Mission Organizations

This article explains how to check whether your organisation shows up, and shows up accurately, in search results and AI-generated answers about your cause. It covers a question registry and a coding method two reviewers can reproduce, plus a share calculation with defined denominators that shows the point at which paid software earns its cost.

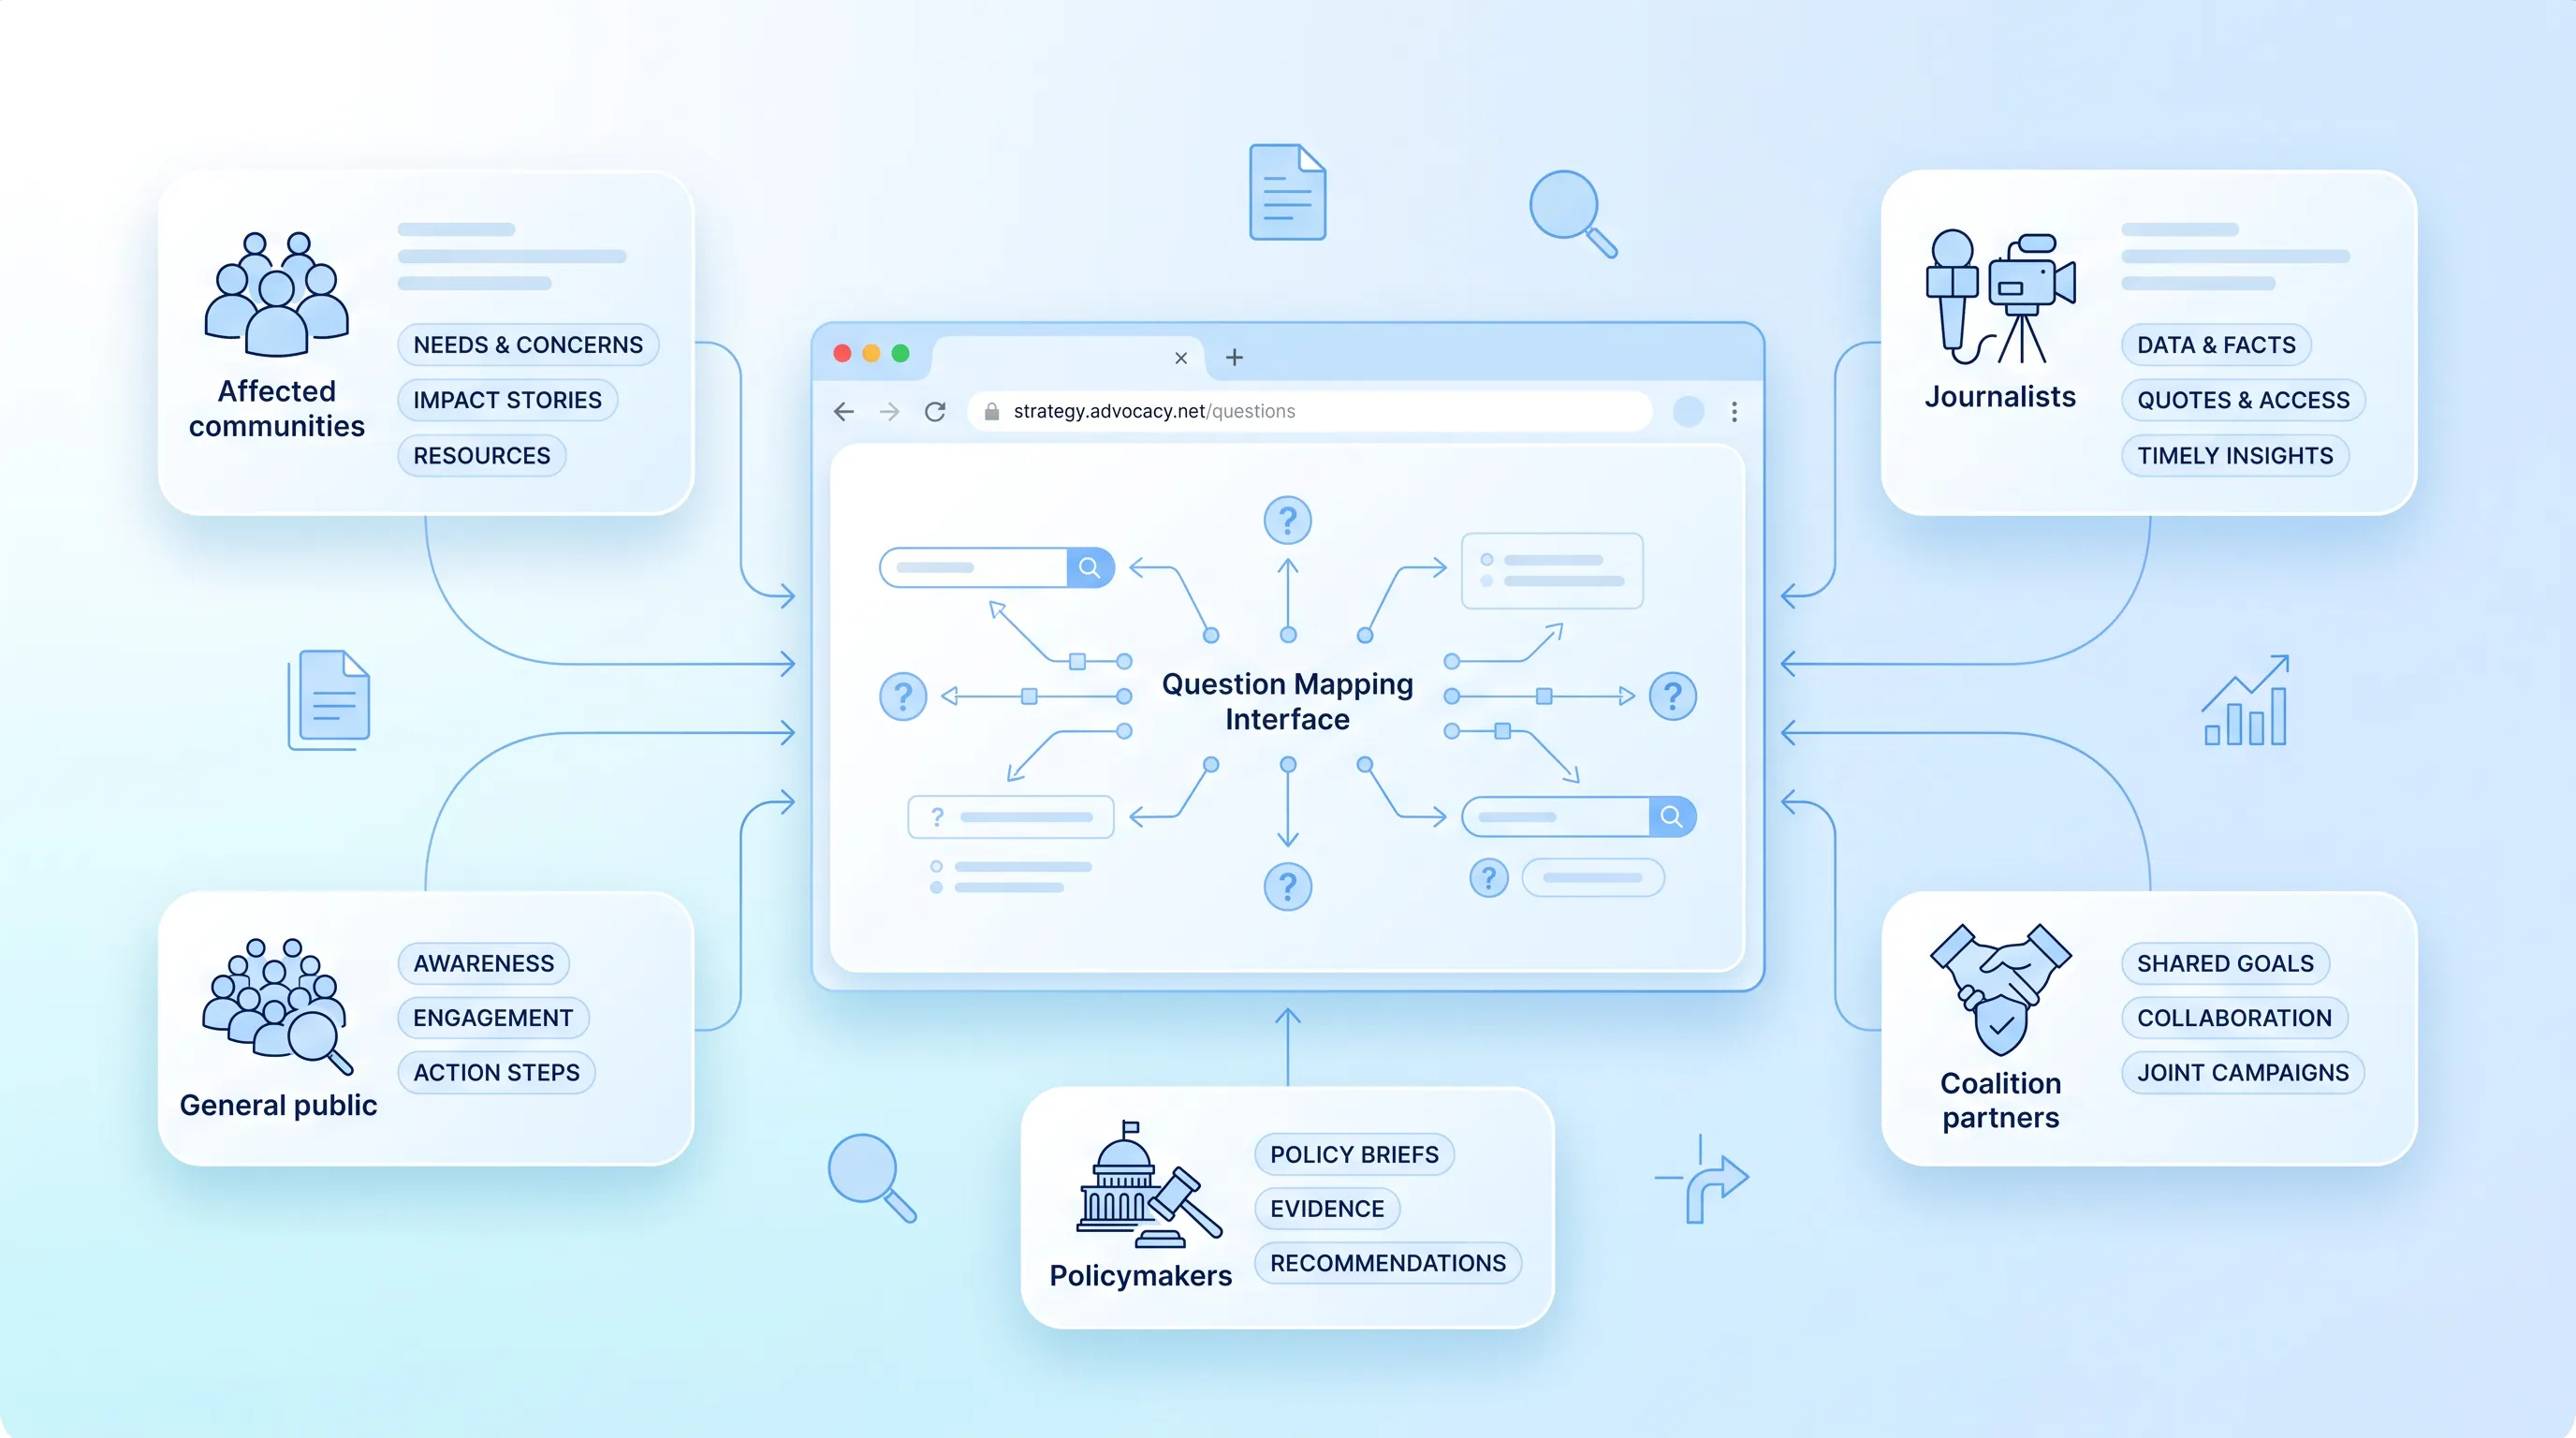
Modern infographic depicting an advocacy content strategy with a central browser window, user group icons, and a soft blue gradient background.

Advocacy Content SEO for Policy and Public Education

This article sets out a practical framework for planning and measuring policy pages so that facts and organisational positions stay separate on the page. It covers question mapping and evidence ranking through an outcome worksheet for ethical evidence publishing built around one clearly fictional proposal.

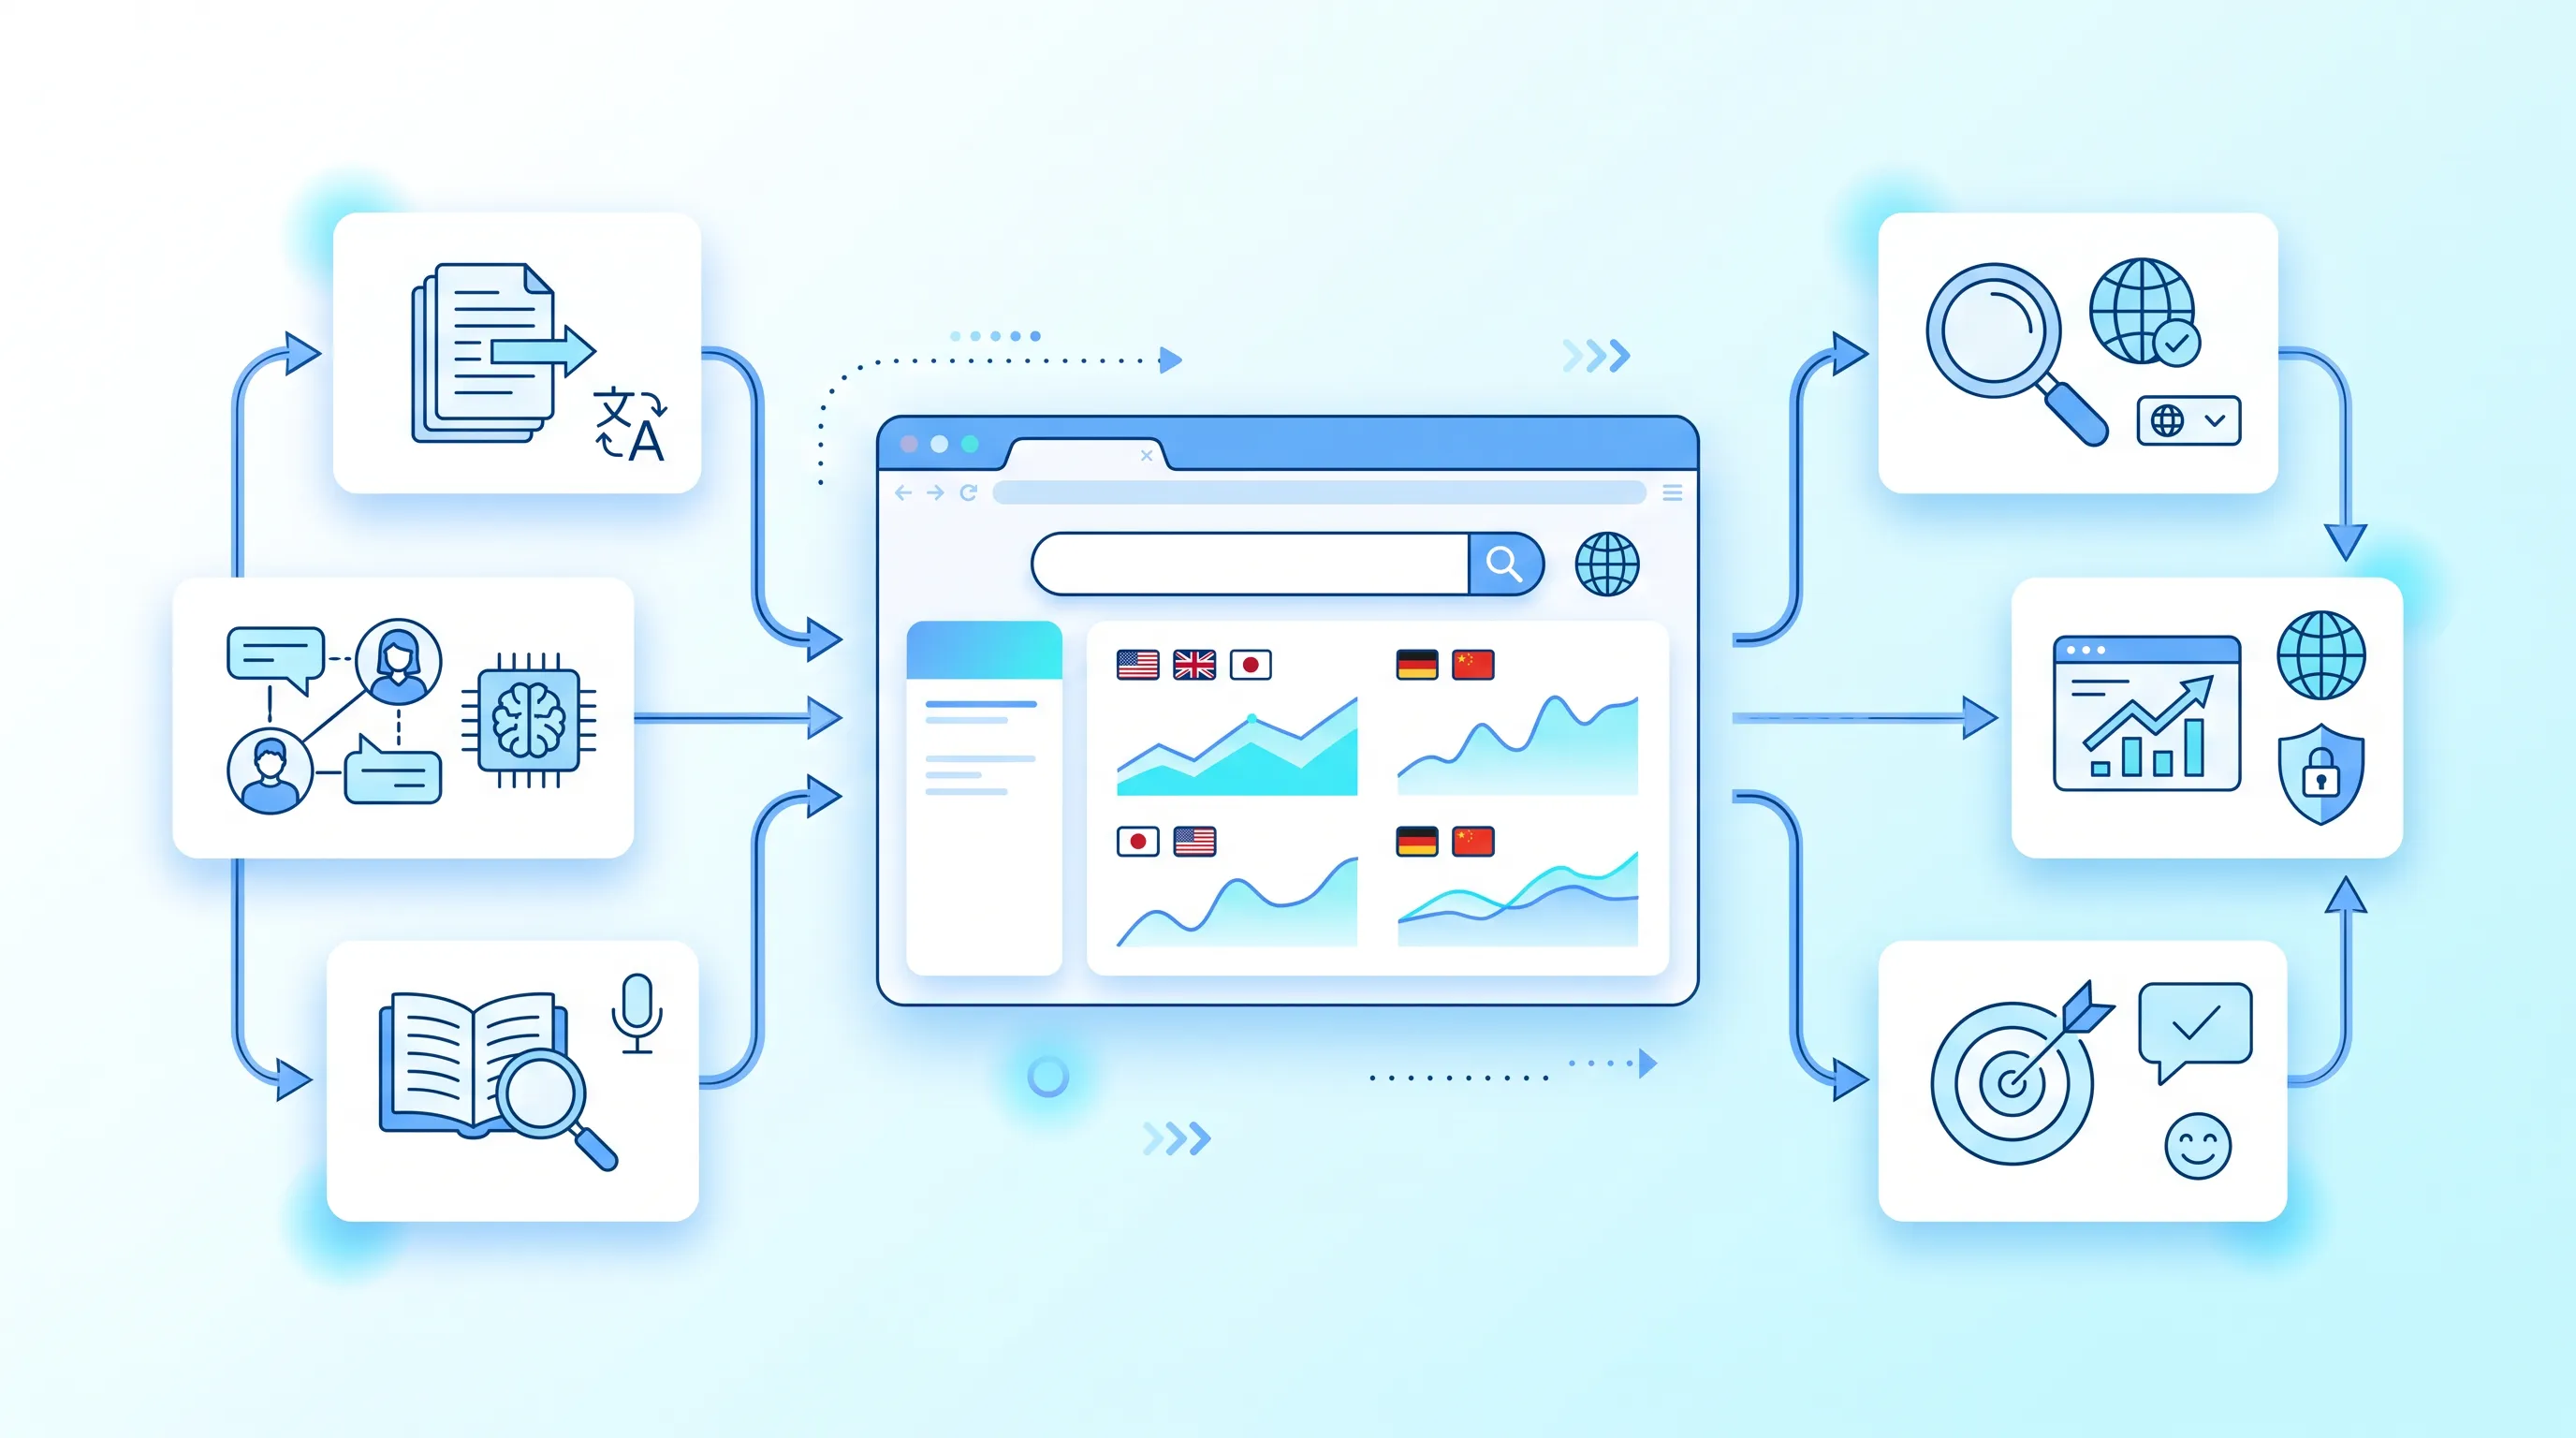
A modern infographic featuring a central web browser window with a multilingual AI dashboard, surrounded by blue line icons on rounded cards.

Multilingual AI Visibility Roadmap for International Missions

This article sets out a prioritized way to decide which languages your organization publishes in and what a complete reader journey looks like in each one. It covers language scoring and localization briefs, then hreflang structure and review gates, along with measurement by language and geography.